Introduction
Over the years, the International Consortium of Investigative Journalists (ICIJ) has exposed hundreds of thousands of documents regarding offshore companies, foundations and trusts from the Pandora Papers, Paradise Papers, Bahama Leaks, Panama Papers, and Offshore Leaks investigations.
Today, instead of trying to view the different investigation data split across different sources and locations, the ICIJ enables easy access to all investigation data in one dataset, so users can explore and analyze the data of shell companies, law firms, banks, and ultimate owners across all leaks and investigations.
In this post, we demonstrate how we took the raw data published by the ICIJ and were able to gain valuable insights from the data using the Timbr SQL knowledge graph. The ability to quickly construct a semantic data model using Timbr enabled us to combine data on various royal families from DBpedia along with the different leaked data presented by the ICIJ. Through this, we were able to create unique explorations and visualizations in the Timbr platform.
Timbr semantic knowledge graph platform
Knowledge graphs allow users to better understand data and answer difficult questions. The Timbr SQL Knowledge Graph platform makes this task simple by conveniently mapping to any database and providing the means to visualize data, explore relationships and utilize graph analytics to deliver unique insights.
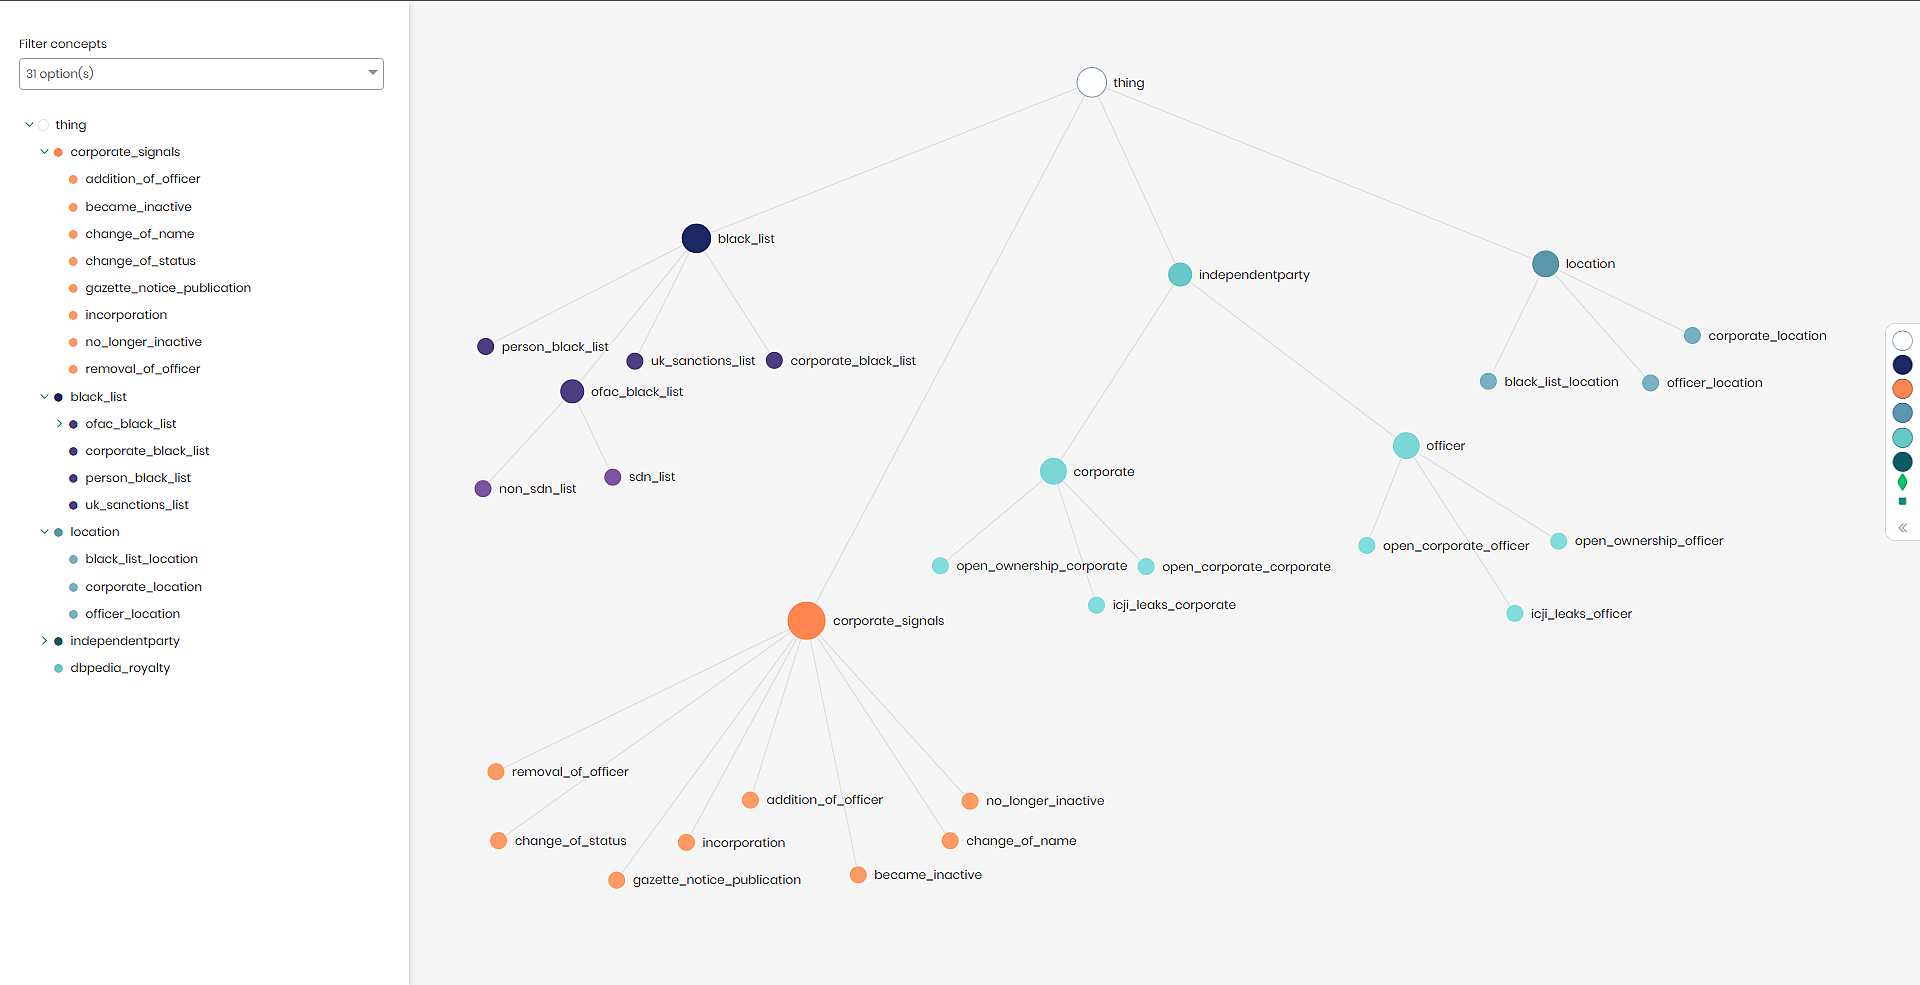
The Timbr SQL knowledge graph is comprised of business concepts that represent the data entities. Each concept has its own properties and relationships with other concepts. Concepts can be extended with sub-concepts as a hierarchy. The sub-concepts represent classifications of the upper-level concept by encoding business rules as filters or segments.
In this specific case, when attempting to explore royalty and offshore companies, we began by determining the different entities and their properties and hierarchies. Next, we created mappings for those entities while cleaning and manipulating the data for proper processing. Finally, we added relationships to the entities based on one or more similar attributes.
Insights via Queries and Visualizations
Analyzing data using Timbr’s semantic SQL
After our semantic model was created and ready, presenting the ICIJ data, we began with our first query requesting to see all companies that are owned by the Saudi royal family. To run this query we used the dtimbr schema, which is timbr’s virtual schema for easily querying data through relationships.
Our semantic SQL query looked as follows:
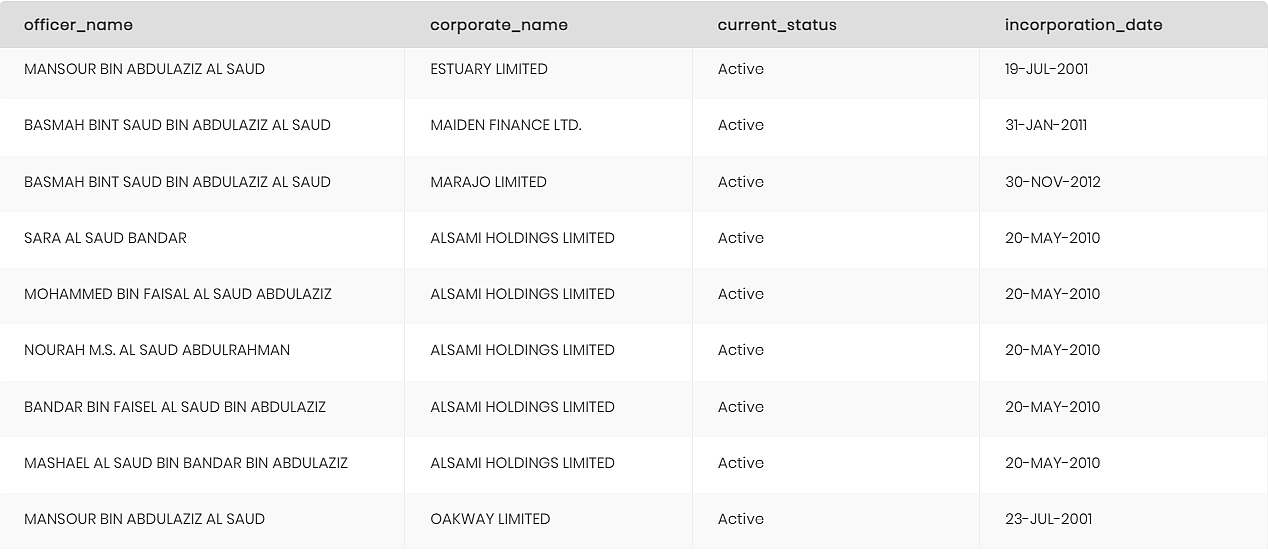
This query was built to find companies owned by the royal family using the relationship “owns_corporate”. This query would also enable us to see the companies’ current status and incorporation date.
These were the results:
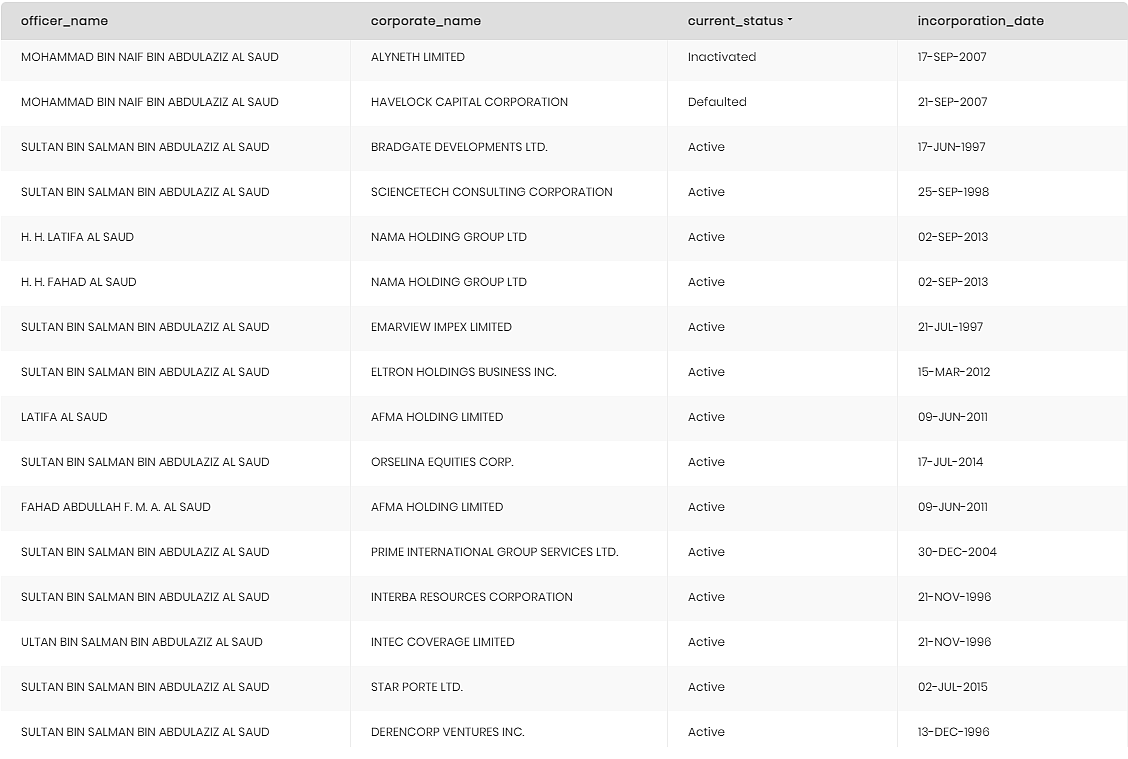
Our second query was similar to the first query, the difference being that instead of finding companies that are owned by the royal family, this query would find companies that the Saudi royal family members work at.
This was our second query:
The change that was made to the query to reflect what we were looking for, was to simply replace the relationship “owns_corporate” with the relationship “works_at”.
These were our results:
Analyzing data using Timbr’s built-in visualization tool
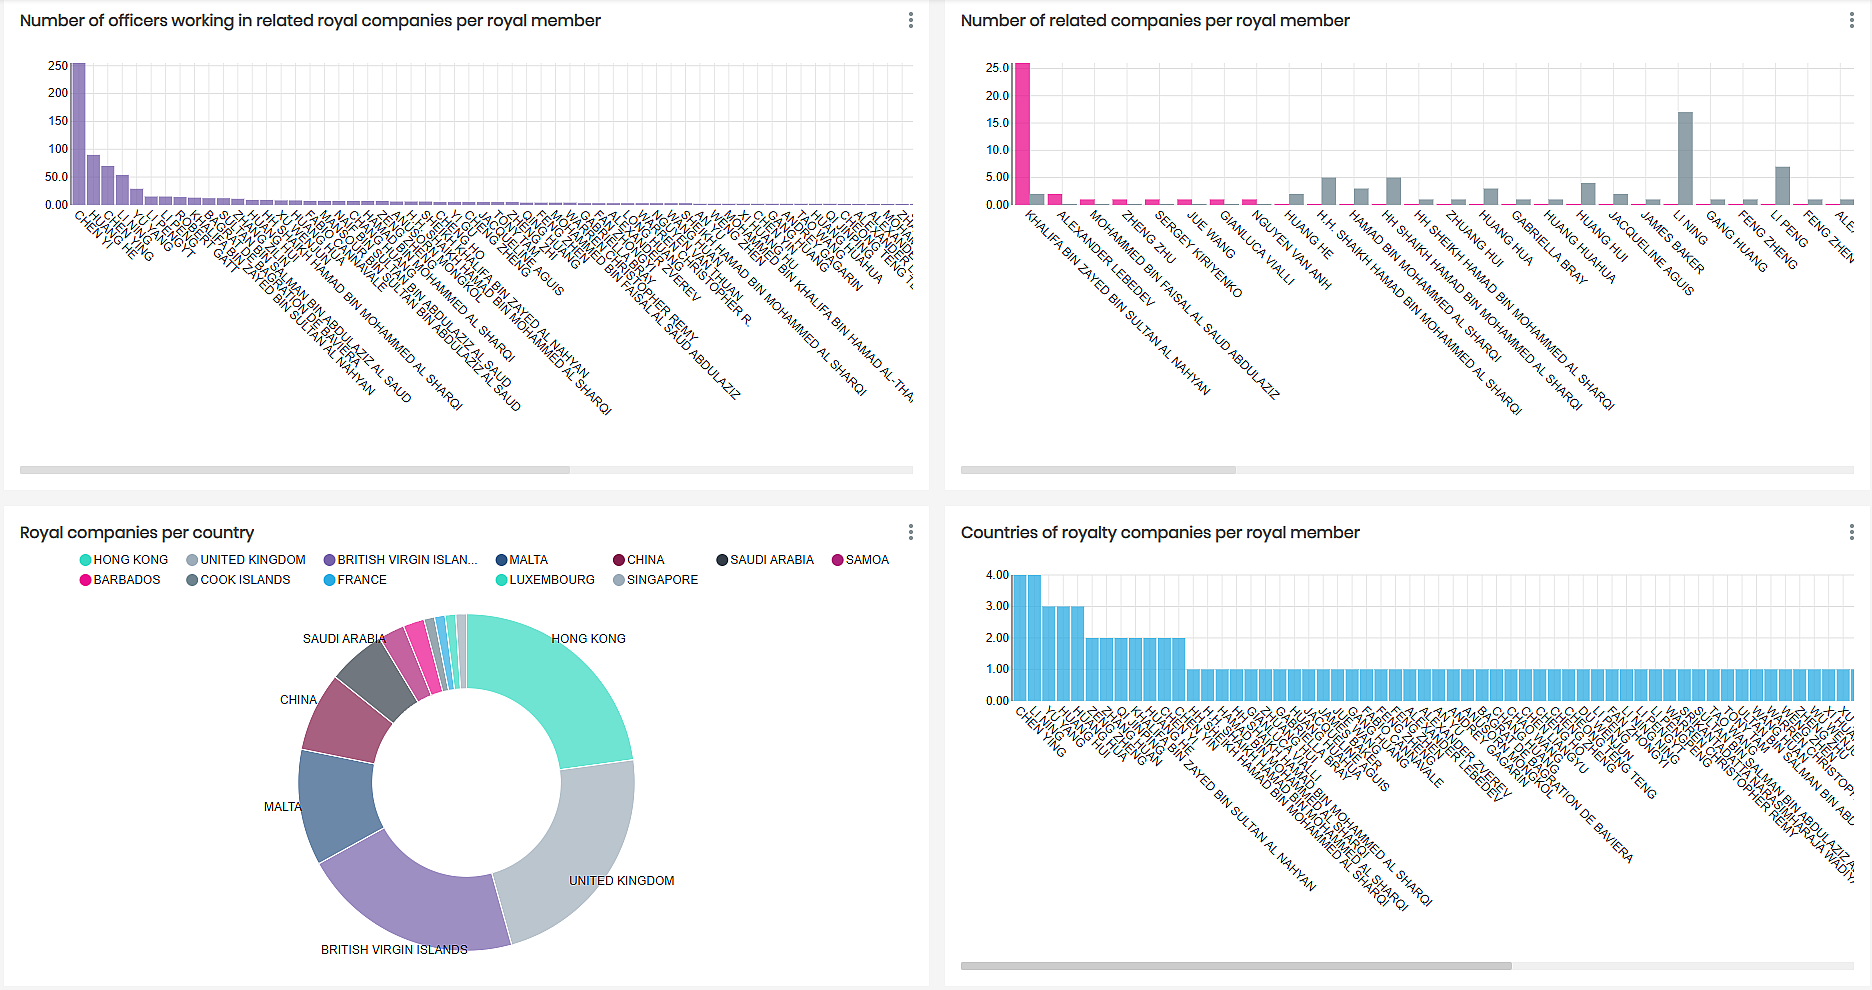
Once we gained our insights through querying the data with semantic SQL, we decided to create a dashboard in Timbr’s built-in BI Tool where we could present and view different segments of companies, places and officers related to members of royal families.
Analyzing data using Timbr’s Graph Explorer
Lastly, we wanted to view the different connections between the Saudi royal family and present them on a graph.
Timbr’s Graph Data Explorer allows users to visualize the underlying data as a graph, in order to explore and discover relationships and dependencies in the data. The module enables traversing through the entire organizational data to discover hidden values, visually find answers, and expose the data without the need of extracting tables or views before running a query.
In our first graph exploration using Timbr’s graph explorer, we wanted to view the connection between the Saudi royal family members and the different ICIJ officers and leaked companies. We entered the concepts with the specific filters we wanted to investigate and asked to see their properties as well.
In this case, we can see a connection between companies associated with three royalty members, their workers, and their current status.
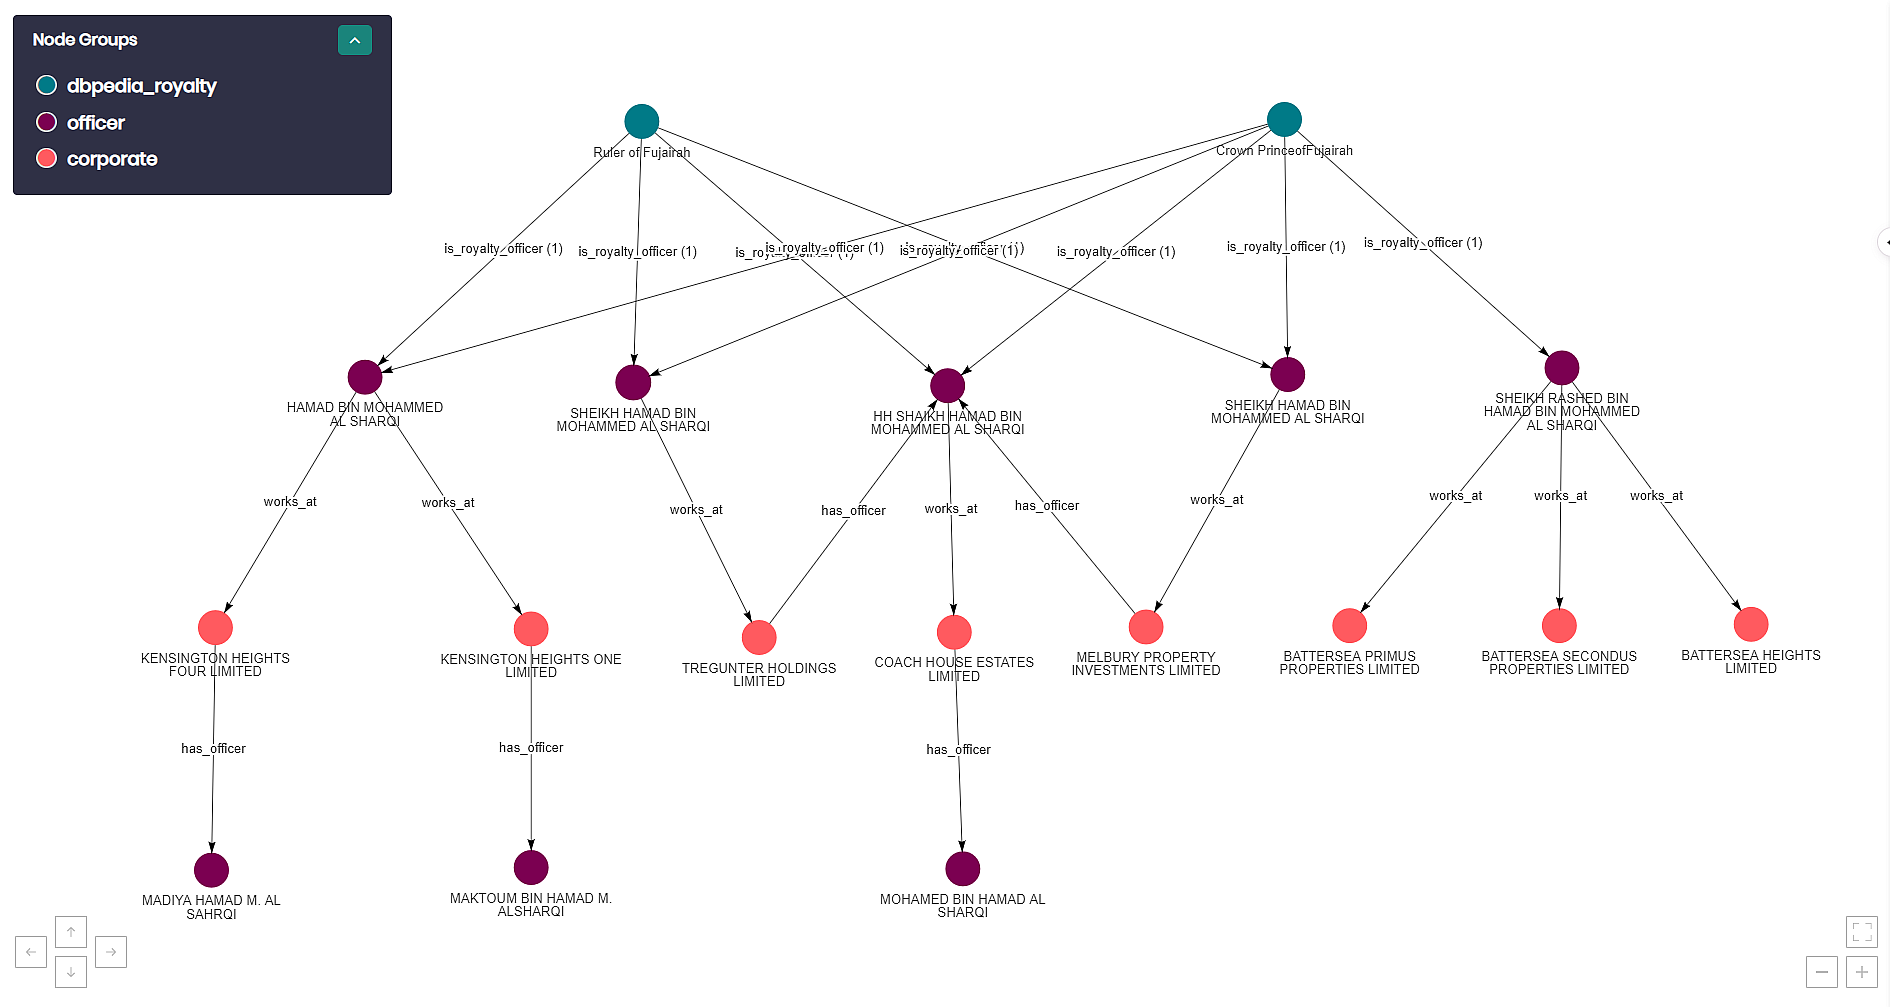
In our second graph exploration, we wanted to zoom in and investigate the data on the prince of Fujairah to visualize and understand the greater picture. After we found the name of the Fujairah prince through DBpedia, we searched for all people that have the same address and a similar name using fuzzy matching. We can see that the prince of Fujairah is related to eight different leaked companies which employ additional people as well.
Conclusion
We were able to demonstrate timbr’s advanced semantic capabilities by easily investigating the ICIJ leaked royalty and offshore companies. By transforming the ICIJ data model into a semantic knowledge graph we were able to intuitively and efficiently investigate different foundations and trusts.
As Timbr enables users to gain insights in many ways, whether it be through semantic SQL, Graph exploration or data visualization all in one platform, Timbr has become an ideal solution for empowering data consumers.
Click here and learn how you too can leverage your data to gain valuable insights, fast and with minimal effort.
How do you make your data smart?
timbr virtually transforms existing databases into semantic SQL knowledge graphs with inference and graph capabilities, so data consumers can deliver fast answers and unique insights with minimum effort.


