In this part 1 of 2, we explain the features and uses of the GA360 SQL knowledge graph.
An off-the-shelf, customizable SQL Knowledge Graph enabled with graph algorithms, turns Google Analytics 360 data export to BigQuery into a user-friendly strategic tool, that shortens data science time-to-value and empowers marketing and sales teams with access to granular-level insights of visitors’ behavior across properties.
Introduction
Google Analytics (GA) is the standard version of the world’s most popular web analytics tool, used in over 40 million websites. The platform enables users to analyze the data generated from website visitors and gather insights that can help them identify opportunities to improve web presence, traffic, conversions and in general, to generate successful digital strategies.
Google Analytics 360 (GA360) was developed as an enhanced version of GA for international companies, big retailers, agencies, etc. with tens of brands, needing to understand and garner insights from visitor behavior across websites, apps, and other properties. GA360 provides enterprise teams with access to advanced capabilities and tools like BigQuery Export, in addition to the features and reports of GA.
The Challenge of Delivering Insights from GA360 BigQuery Exports
To perform advanced analytics of GA360 data stored in BigQuery, users require to understand the physical structure of many tables and columns where data is stored and must be capable to create the complex SQL queries in BigQuery dialects, UNNEST records, etc., needed to deliver actionable answers.
This expertise is usually in the realm of data scientists or data engineers, beyond the skills of marketing and sales teams that work with business intelligence tools such as Power BI, Data Studio, Tableau, etc. As a result, time to value depends on the availability and response time of the skilled personnel whose work product is often difficult to share and re-use.
In addition, when analytics require to incorporate advanced decision-support graph algorithms such as PageRank, Similarity, Community and Centrality, the task of performing such analytics requires transformation of data into a graph structure. This task is cumbersome, complex and time consuming and requires specific, usually scarce expert personnel to perform it, so time to value is prolonged.
The GA360 SQL Knowledge Graph
A SQL knowledge graph is a virtual layer of connected, context-enriched concepts with inference capabilities (an “ontology“), mapped to one or multiple data sources. These ontology concepts represent the business language and extend the database schema and table definitions, enabling any data consumer to view, understand and query the data by its meaning, without the need of knowing in which tables or columns the data is stored.
The timbr SQL knowledge graph platform offers a basic GA360 SQL ontology template that users can conveniently connect to GA360 exports to BigQuery in almost no-time. The resulting GA360 SQL knowledge graph, queryable in SQL and empowered with graph algorithms, is a user-friendly strategic tool, that shortens time to value and provides data scientists, analysts and consumers with unique analytical capabilities for granular-level understanding of visitors’ behavior across properties.
GA360 SQL knowledge graph features:
- Simpler, shortened SQL queries with autocomplete and graph capabilities that anyone can understand, easily accessible from any BI tool.
- Data federation with external sources.
- Unique GA360 BigQuery data exploration and visualization as a graph of relationships.
- Self-explanatory GA360 SQL ontology structure that translates columns & records to hierarchies of concepts & properties.
- User-friendly visualization and exploration of the GA360 SQL ontology.
- Powerful, easy to use graph algorithms that deliver unique insights about the data.
Creating the GA360 SQL Knowledge Graph
timbr users create their organization-specific GA360 SQL knowledge graph in three simple steps:
1. Selecting the GA360 SQL ontology template.
2. Connecting to their GA360 BigQuery export.
3. Mapping the BigQuery tables to the ontology.
The GA360 SQL Ontology Template
The GA360 SQL ontology template is modeled after the Big Query Schema for the purpose of representing the tables and columns that store the GA360 BigQuery export.
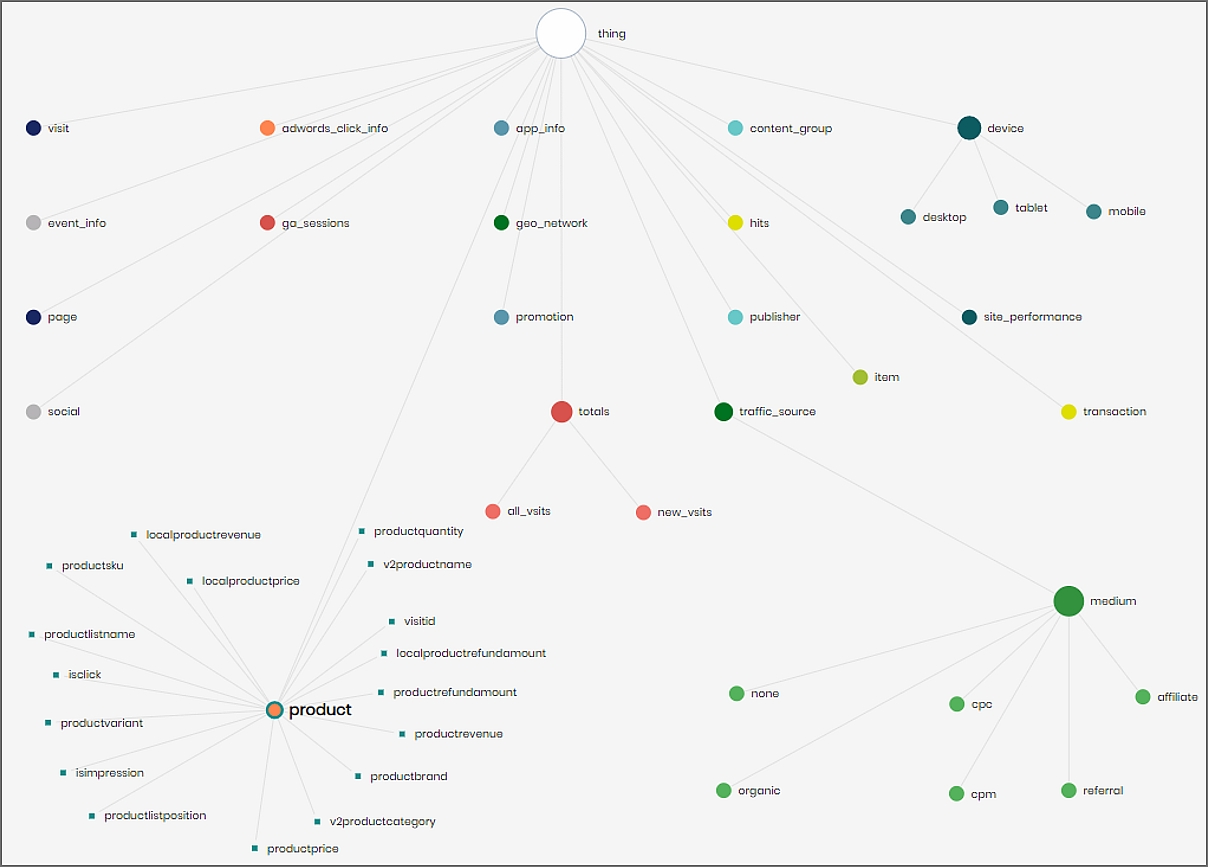
The timbr platform provides a convenient ontology exploration tool that displays the concepts as a network of relationships as seen in Figure 1. Users may click on a concept to read the concept’s definition, properties, relationships and underlying data.
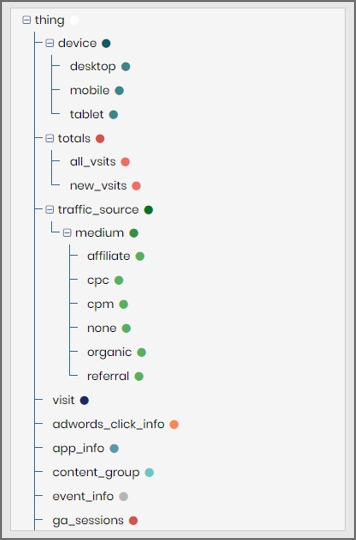
The ontology explorer also displays the ontology tree (Figure 2) that enables users to easily understand the hierarchy, structure and categorization of the concepts that represent the underlying data.
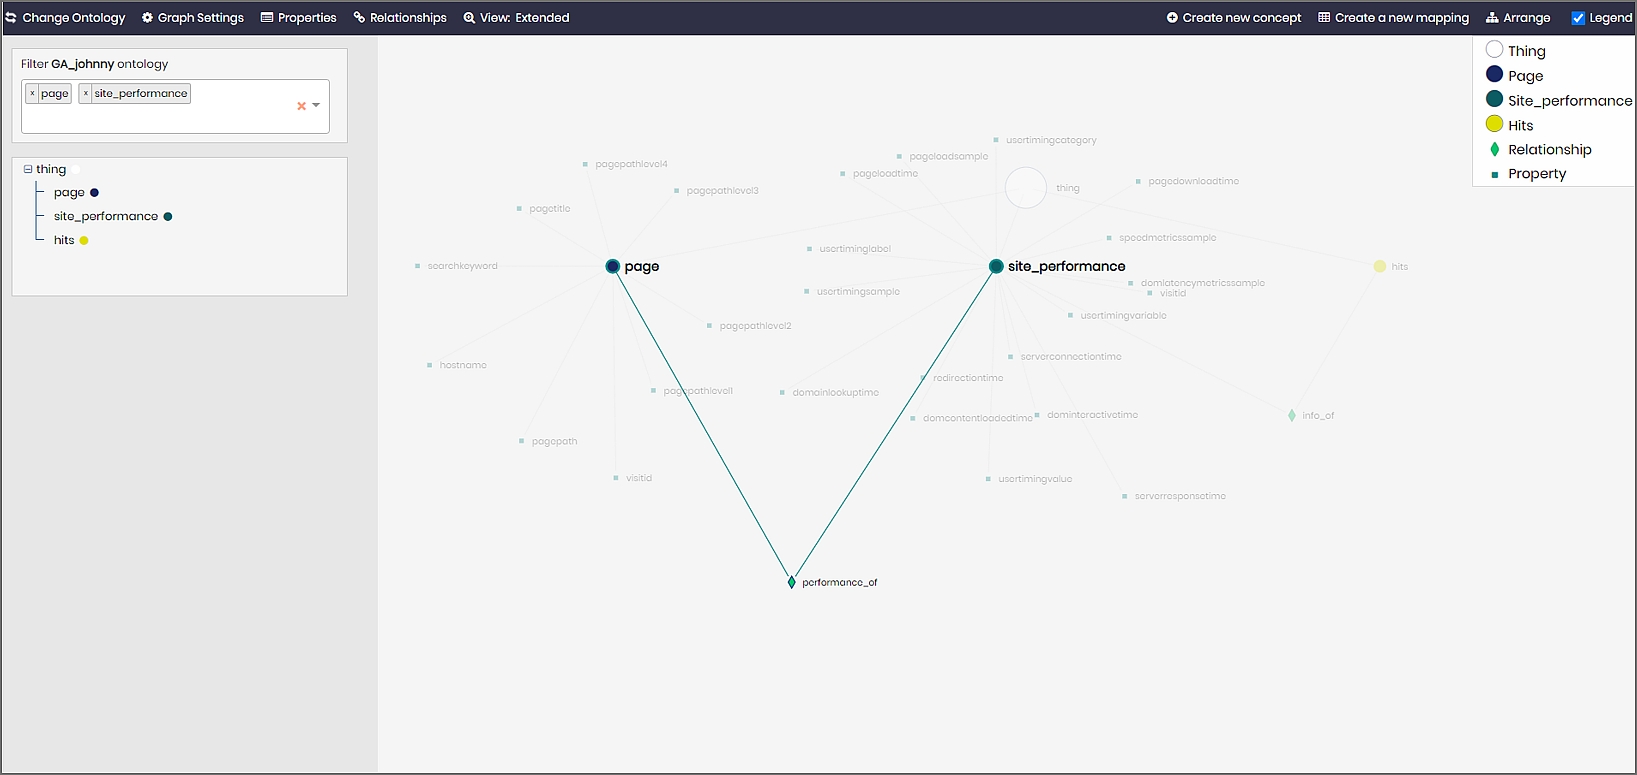
Users may also click on a concept to display relationships to other concepts (Figure 3).
In addition, users are free to customize the GA360 SQL Ontology template as required, by manually modeling additional concepts and relationships that represent specific sources of data such as applications or other properties. As a result, users gain a 360° view of data that is accessible with simple SQL queries.
Data Exploration and Visualization as a Graph of Relationships
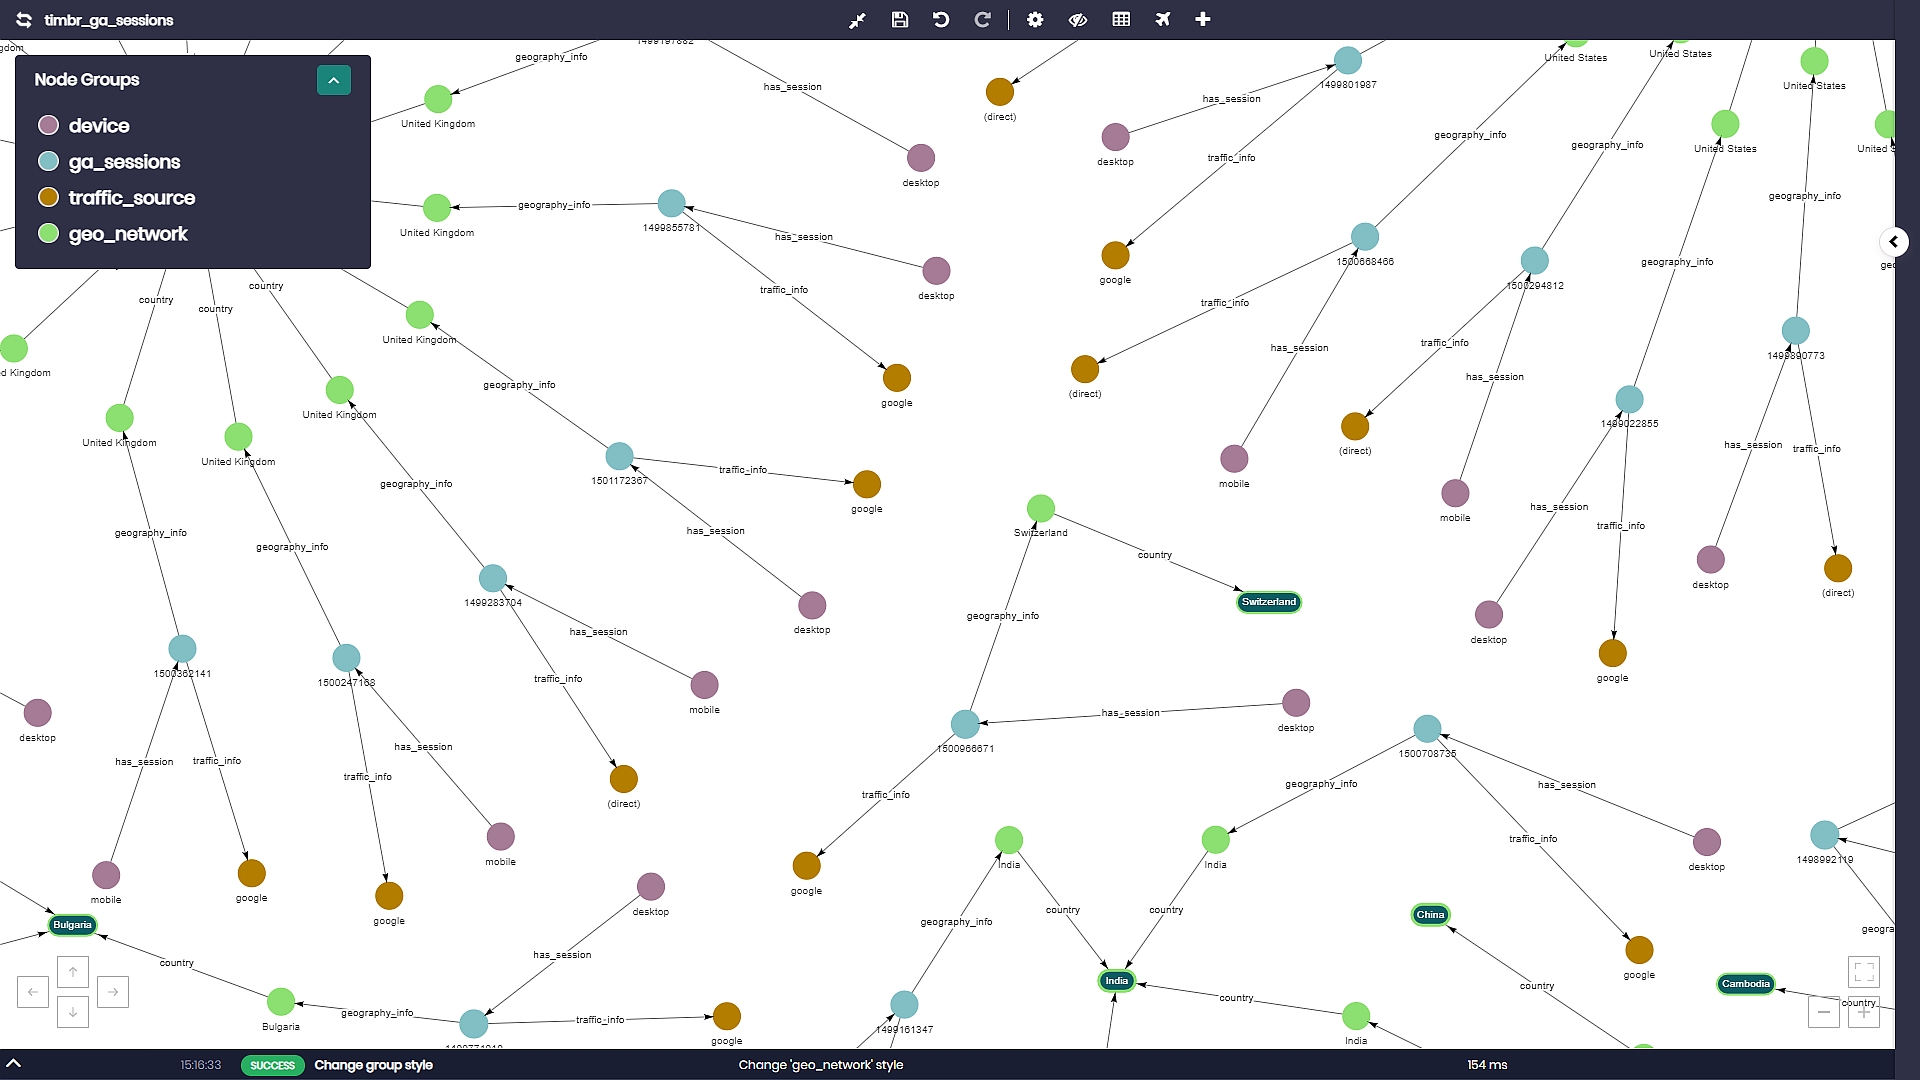
timbr’s Graph Data Explorer allows users to visualize the underlying data as a graph, to explore and discover relationships and dependencies in the data. The module enables traversing the entire GA360 data so users can better understand the data, discover hidden value, visually find answers and expose the data without need of extracting tables or views before running a query (Figure 4).
Simplified SQL Queries
One of the most powerful features of the SQL Knowledge Graph is that SQL queries of concepts (semantic SQL) are up to 90% shorter, simpler and more understandable than direct SQL queries of the underlying data. This is thanks to the ontology’s concepts inference capabilities and to the concepts’ encapsulation of relationships, so there’s no need to write SQL statements with inner Joins or UNNEST functions.
As a result, even moderately proficient SQL users can query the GA360 SQL knowledge graph. In addition, skilled users desiring to perform more complex analytics can also query the graph in Apache Spark, R, Python, Scala and Java.
To illustrate the power of semantic SQL, let’s look at some common business questions:
Example 1: Promotion numbers by custom dimension and social network, with timbr’s semantic SQL:
Example 2: Number of sessions of new users by country, source and medium, with timbr’s semantic SQL:
Example 3: What is the average page load time in seconds by country, device and browser? With timbr’s semantic SQL:
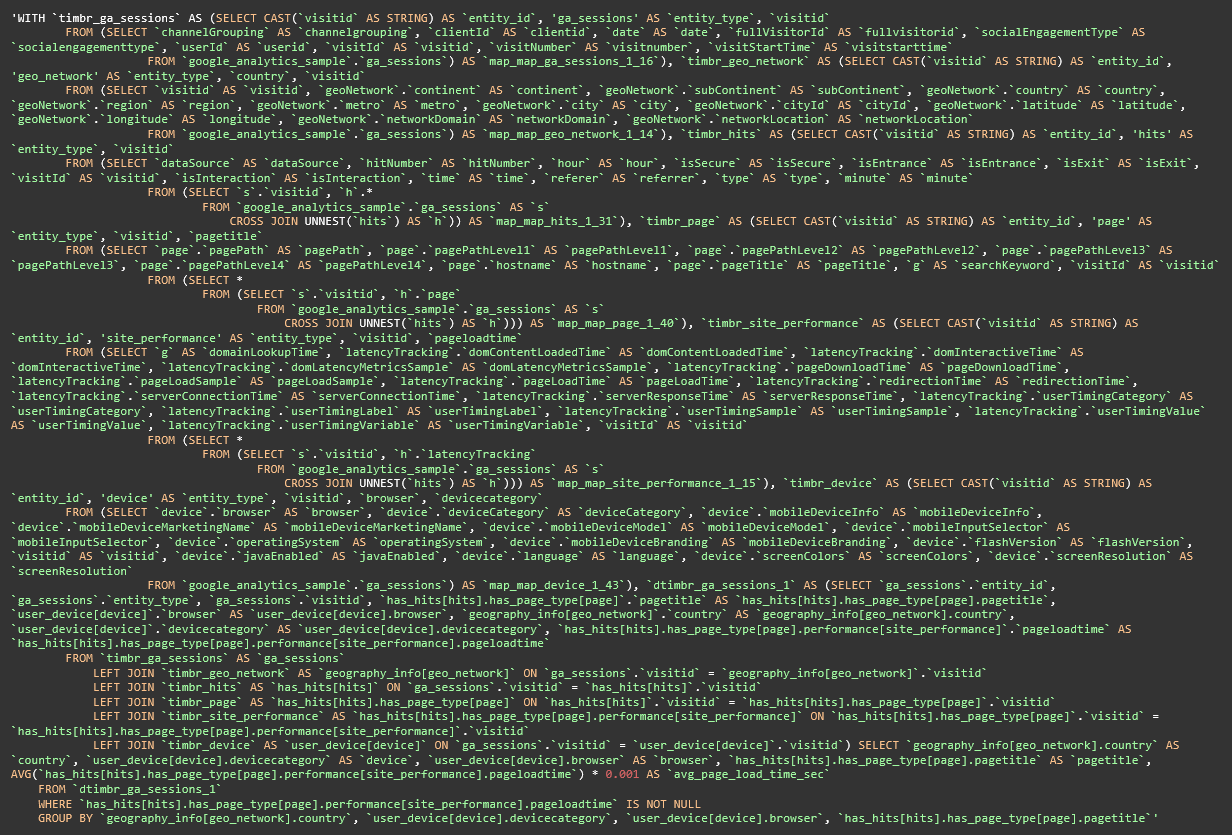
In comparison, a snippet of the direct SQL query of BigQuery of example 3 would look like:
Data Federation with External Data
The GA360 SQL knowledge graph enables users to enrich and extend the knowledge base by federating their GA360 BigQuery data with any external data, whether the data is in BigQuery or any other database such as Postgres, SQL Server, Athena, Spark etc.
Federation can be implemented either by introducing new concepts and relationships to the GA360 SQL Ontology or by mapping additional data sources to existing concepts.
In Short
The customizable SQL knowledge graph powered with graph algorithms, turns GA360 BigQuery export into a user-friendly strategic tool that shortens time to value.
Data consumers can easily understand, explore and query the data by means of concepts, instead of dealing with a large number of tables and columns.
Business users can query the knowledge graph visually, with simple SQL queries or directly from their BI tools, while data scientists can seamlessly connect Jupyter and Zeppelin notebooks via JDBC and ODBC to reduce time spent in the menial tasks of organizing, collecting and mining the data.
In part 2 we explore how graph algorithms generate unique insights from the GA360 SQL knowledge graph .
Contact us to test drive the GA360 SQL Knowledge Graph on the sample public dataset or on your own GA360 BigQuery export. Set up in just a few minutes so you can start unleashing the power of your data today.
How do you make your data smart?
Timbr virtually transforms existing databases into semantic SQL knowledge graphs with inference and graph capabilities, so data consumers can deliver fast answers and unique insights with minimum effort.
