Using your SQL Knowledge Graph
BI Charts and Dashboards
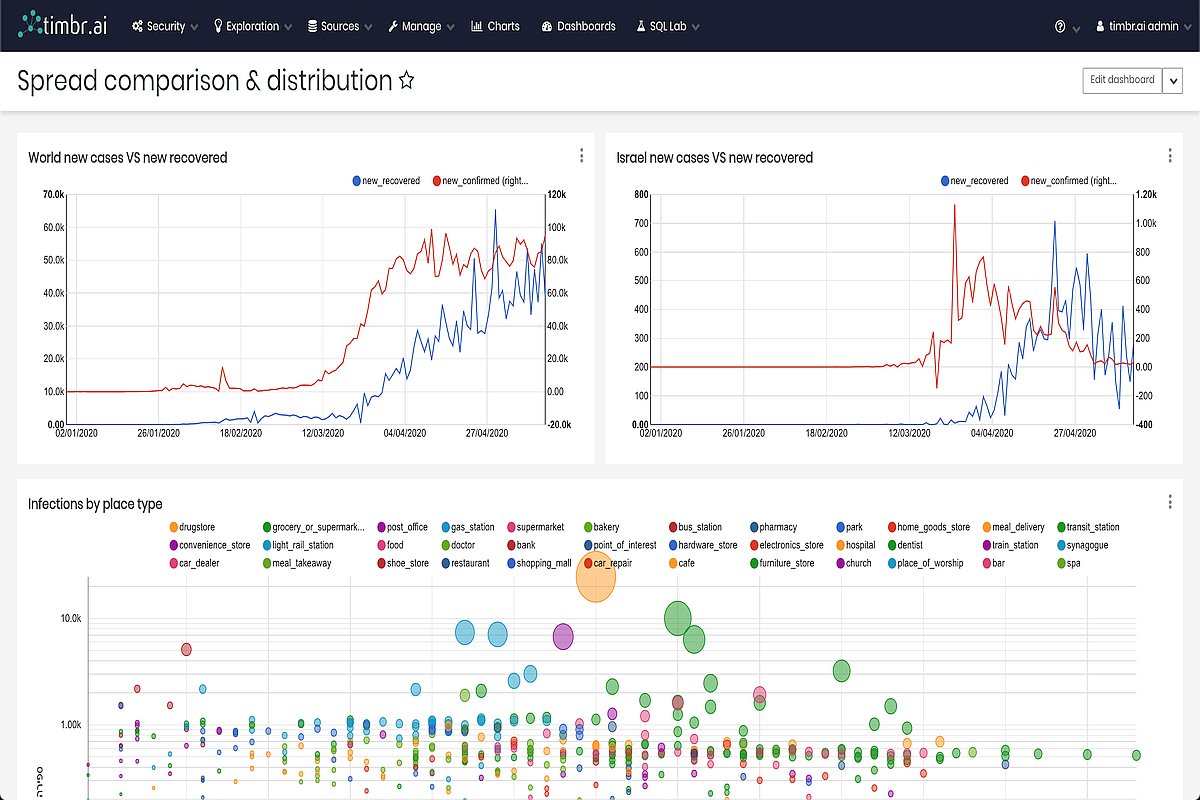
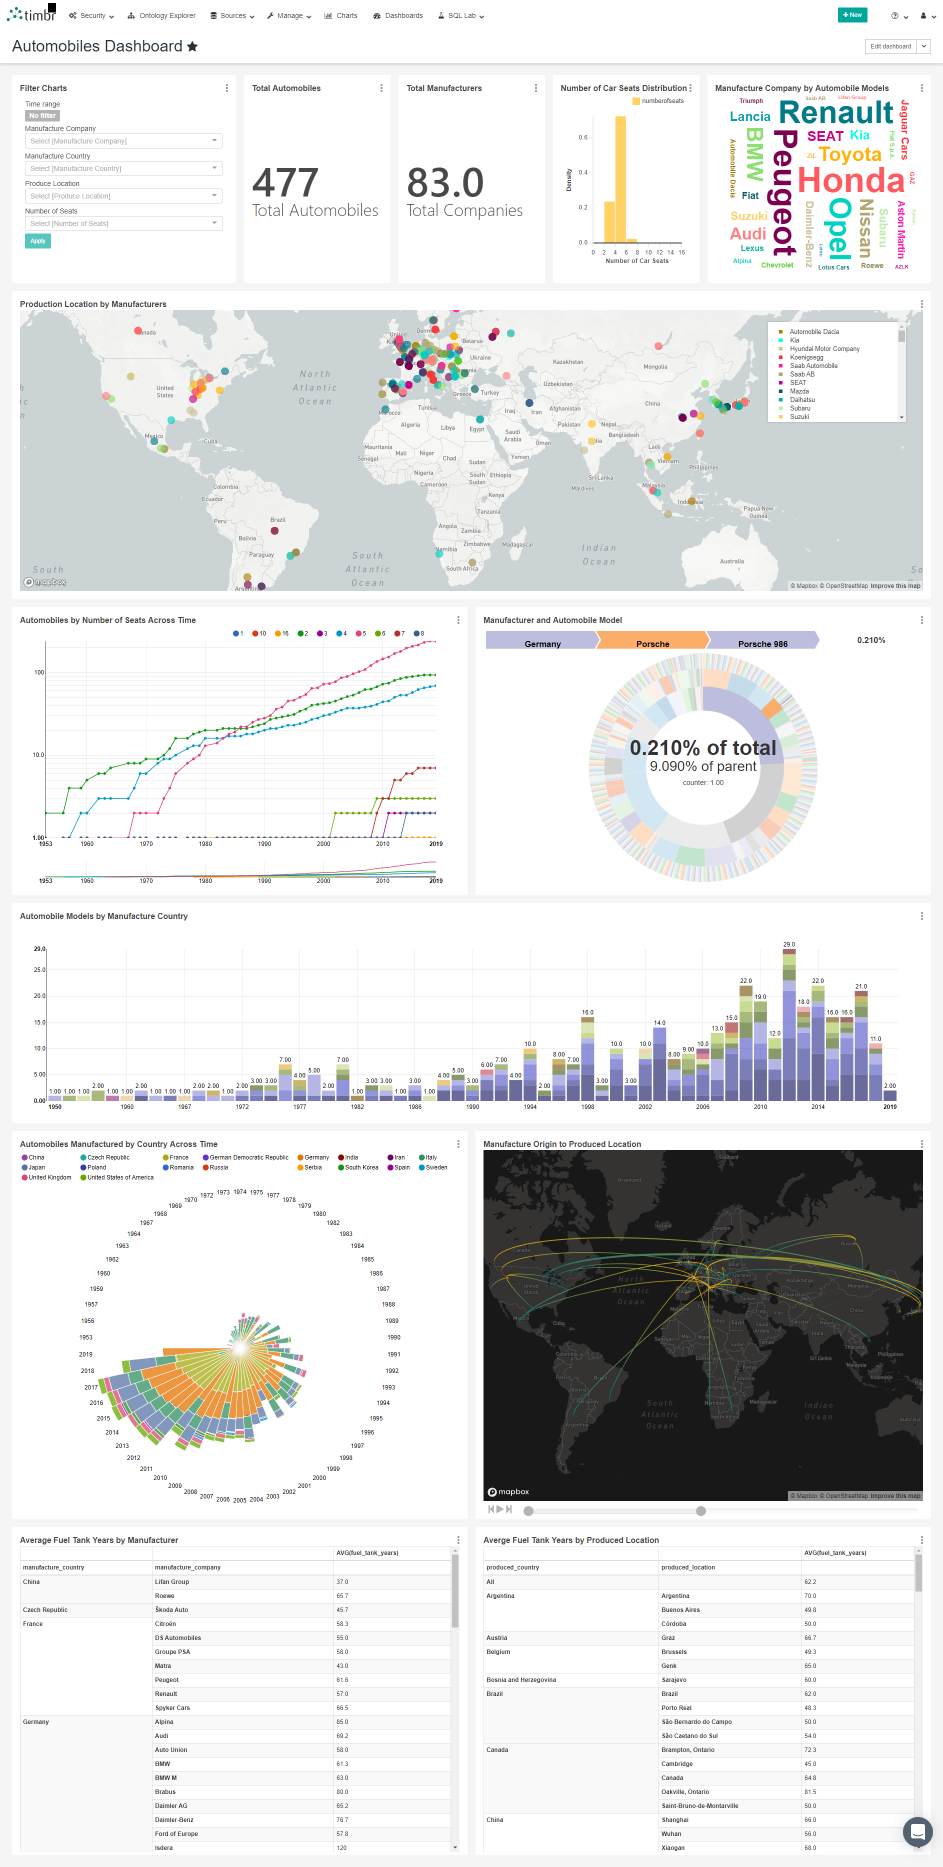
Timbr users may connect their own BI tool to the SQL Knowledge Graph with JDBC or ODBC connectors or use Timbr’s embedded BI to deliver insights and display query results as tables, charts and dashboards.
- Empower your analysts to answer complex questions
- Create visualizations that deliver powerful insights from the SQL KG
- Automatically update your charts and dashboards as data is added

Play Video


