What should we eat if we have certain dietary restrictions or pressing medical conditions? To answer this question we need to know what nutrients are contained in the food we consume and how these nutrients affect our health, and then we must be able to infer, from among the many possible connections, which kind of foods are good for specific goals or conditions. We find these answers in the Dietary Recommendations Knowledge Graph created with Timbr by Ty Farris, David Lutze, Jake Tallman, Evan Zhang and Parker Mitchell, under the guidance of Professor Franz J. Kurfess, Cal Poly San Luis Obispo, Computer Science and Software Engineering Department.
Table of Contents
Introduction
Nutrition is a critical part of health. There is an abundance of information available on the internet about food and recipes on one hand and health monitoring on the other. However, the information in each field is generated independently so identifying how one affects the other in a granular way can be difficult.
One example of the benefits of understanding this relationship concerns some of the leading causes of death worldwide such as heart disease and diabetes. How can an average consumer determine what foods can improve his chances of preventing these diseases?
Knowledge graphs allow users to better understand data and answer difficult questions. The Timbr SQL Knowledge Graph platform makes this task simple by conveniently mapping to any database and providing the means to visualize data, explore relationships and utilize graph analytics to deliver unique insights.
In this paper we present an extract of a report written by students from the Computer Science and Software Engineering Department of Cal Poly San Luis Obispo. The students used the Timbr platform to create a Dietary Recommendations Knowledge Graph mapped to the AACT Database of clinical trials and a food nutrition database, to allow users to query and gain insights regarding food and health. Timbr was utilized for linking these separate databases into two ontologies using Jupyter notebooks, SQL and Python to create linking tables between databases.
The Goal
The purpose of the project was to create an easy-to-use personalization platform to allow users to achieve their dietary goals by generating general nutritional recommendations based on their eating behaviors. To achieve this goal, the project would identify meaningful relationships and insights relating the AACT Database of Clinical Trials and the ‘Food and Nutrient’ Database for Dietary Studies by means of an easy to use and implement Knowledge Graph for Dietary Recommendations. The graph would provide users with recipe recommendations for their personal health conditions. A possible add-on was to enrich the Knowledge Graph using deep learning.
The context of this project was rooted in the relationships between food and human health. While people know that some foods are generally better for their health than others, the majority of people don’t know what foods to eat if they have certain dietary restrictions or pressing medical conditions. As such, this project finds itself at the crossroads of health and knowledge, falling in a nutritional-information sector.
Nutrition science and dietary recommendations are becoming increasingly important in this day and age due to chronic diseases like obesity, diabetes, osteoporosis and more on the rise. With this knowledge graph, the aim was to provide more recommendations for those with specific dietary needs to lead healthier lives. The intended users of this dietary recommendation knowledge graph could include everyone interested in healthy nutrition habits, but could be more specifically targeted for 3-4 groups. The first group of users could consist of people who, on their own, actively seek out a diet that would aid them in working around a medical condition or restriction, or who are simply looking to eat healthier. An example of this would be a person who wants to find pasta recipes for people with high blood pressure. The second group of users could consist of doctors, nurses, and other medical practitioners that need to recommend certain diets for their patients. Oftentimes these medical professionals will suggest general diets for patients, but with this knowledge graph they could provide more in-depth dietary suggestions tailored to their patients’ needs. The final group of users could consist of private dietitians and nutritionists looking to fulfill their clients’ dietary constraints and desires. Such people could use this knowledge graph in the same ways as mentioned above to aid their clients. While these are the user groups we see as the most prominent intended users, we believe that because everyone eats food, everyone could have something to gain from this knowledge graph.
The Means
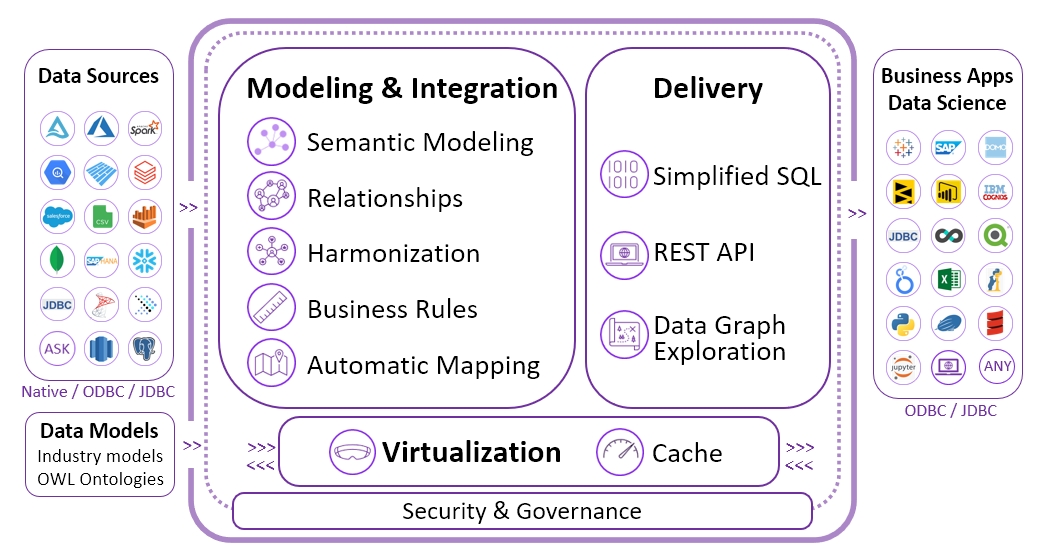
The primary technology selected for this project was the Timbr Semantic Graph Data Management platform. This platform provides the means to create SQL-queryable ontologies and conveniently map them to multiple databases and other data sources.
By modeling the data using semantic meaning and relationships on top of existing databases, Timbr facilitates understanding and access of the data organized in many and varied tables. Through Timbr’s platform modules, all the tools needed are supplied to allow for meaningful abstractions, well-structured and hierarchical relationships, reasoning, data visualization and discovery.
The following languages are supported on the platform: SQL, Apache, Spark, Python, R, Java and Scala, so both BI tools and Data Science tools can be used to query the graph. From a Timbr knowledge graph perspective information can be easily gathered by querying a concept and any other concepts that share a relation or a string of relationships.
In this project, the Timbr platform provided tools that allowed the connection of entity-concepts (like “food”, or “dietary supplement interventions”), forming relationships that map to latent SQL queries. On top of this, Timbr Graph Explorer tool was used, which enabled the visualization of different concepts (nodes) and their relations (edges) to one another, as shown in the figure below.
An additional feature that Timbr provides is its own business intelligence tool which allows the user to create charts and dashboards. This tool allows further insights and analysis to be pulled from the SQL knowledge graph.
Another way Timbr allows users to interface with their data is by enabling them with graph analytics. Users can run graph algorithms from the business intelligence tools or right over the data on-site. Graph analytics enable users to discover insights, gain recommendations and enrich their ontologies and data.
Implementation
The project connected two large datasets, one of clinical trials from the AACT database containing 53 tables and stored in PostgreSQL, the second of dietary features from the FNDDS containing 5 tables and stored in PostgreSQL.
The Timbr ontology modeler was used to automatically create an ontology for each one of the databases, so that a concept in the ontology represented a table in the database. Then the data mapper was used to map the data to the ontologies.
The next step was to combine both ontologies into a single knowledge graph to perform queries and graph traversals. This broke the work into two sections, creating relationships between the two graphs and generating queries to answer user questions. Shown in Figure 4 is a clipping from the clinical trials and food ontologies connected.
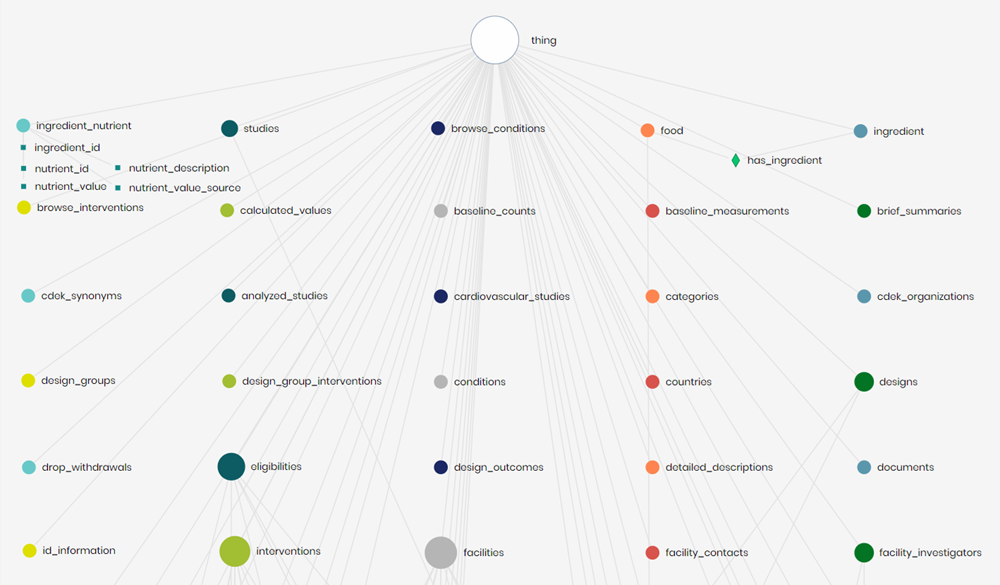
To connect the ontologies, a few connections were determined and implemented on the ingredient_nutrient concept (of the nutrition ontology) to concepts of the clinical studies ontology. These concepts relate directly to nutrition intervention or observation.
The rest of the project focused on creating queries that can glean useful info without requiring the creation of new concepts or relationships. One such example was to use a relationship of nutrient intervention to determine what women over the age of 65 with diabetes should eat by filtering eligibility, then studies that relate to nutrient intervention, then foods that include the nutrient introduced.
Prototype Functionality
As the main goal and challenge for the project was determining how to connect the clinical trials dataset and the food/nutrition dataset, some time had to be spent exploring the data to find relevant tables and columns that could serve as connections. It was determined that on the food/nutrition side of things, the most important data column was the nutrient_description column from the ingredient_nutrient table.
This column contains values such as “Protein”, “Water”, “Vitamin A” etc. This is the most relevant data column because the language in the clinical trials dataset does not ever directly mention foods, but does mention essential nutrients. Once this data column was isolated, finding a data column within the clinical trials dataset that lists similar values was needed, which would enable the connection of the two datasets. An excellent candidate was the name column from the dietary_suppliment_intervention concept. This column contained similar values to the previous column such as “Vitamin D”, “Plain Milk”, “Fish Oil” etc., so a relationship was created between the two concepts called used_in, where a certain nutrient was used_in a specific clinical trial.
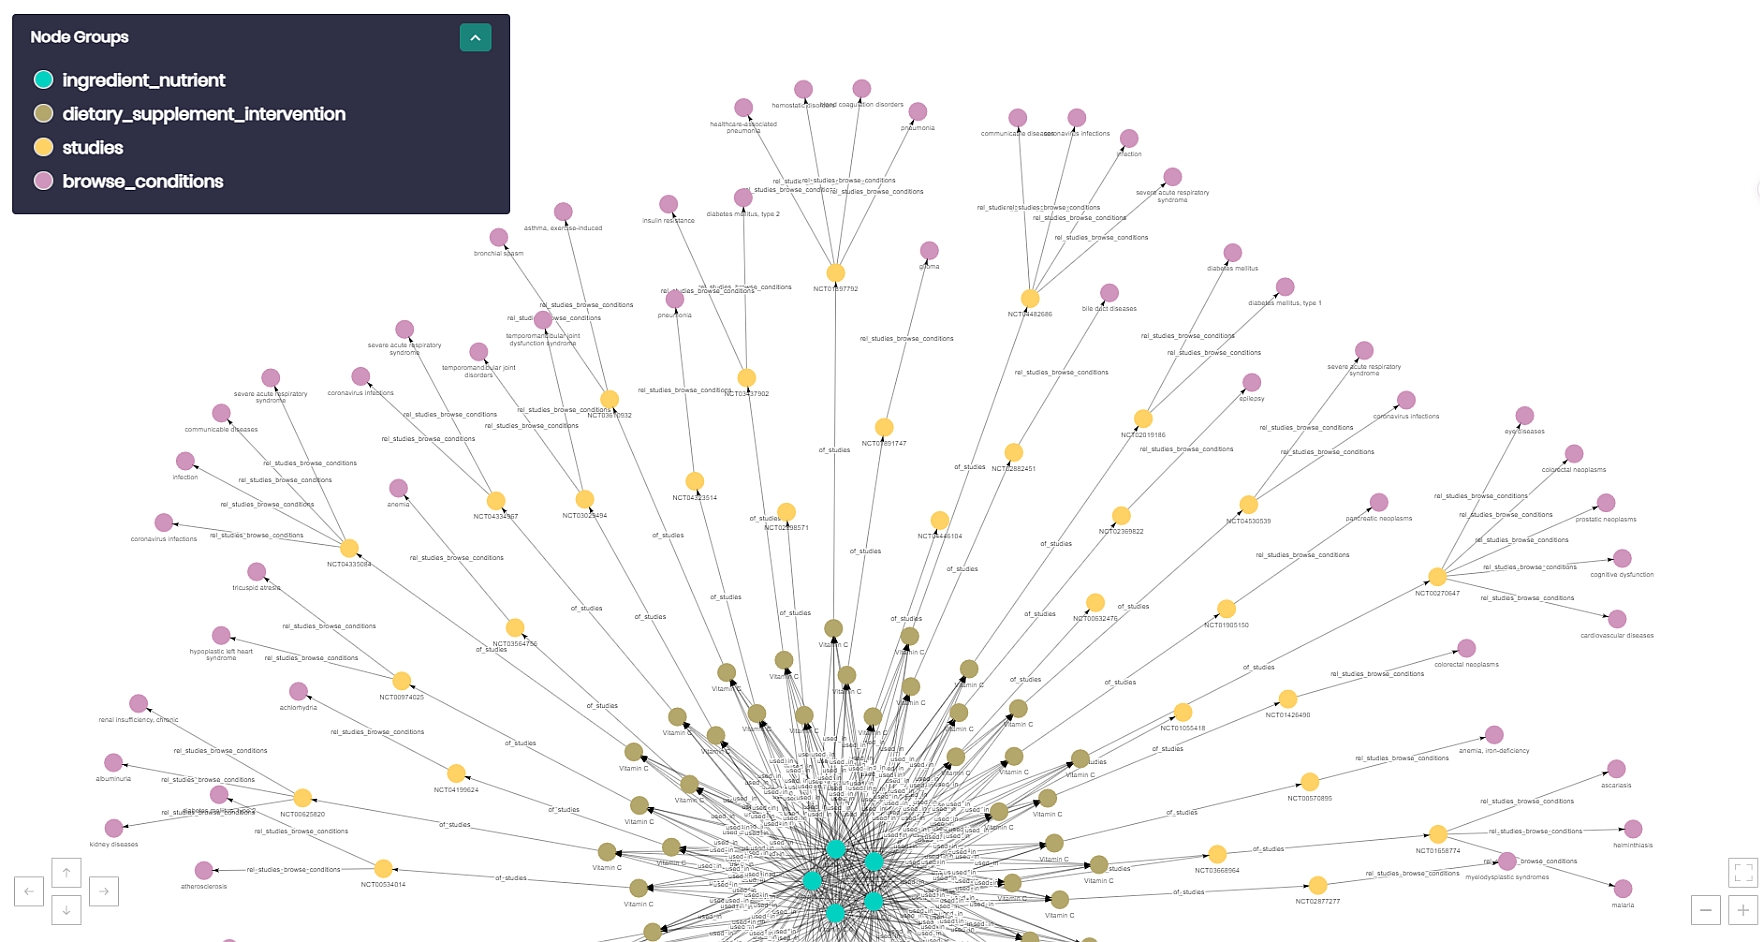
In order to verify that this was a meaningful connection, Timbr’s graph explorer was put up to the test. The result of this graph exploration is shown in Figure 5 above.
The exploration started from the ingredient nutrient concept, and connected all the way through to specific conditions. The blue dots at the center of the figure represent vitamin C from the ingredient_nutrient concept. The brown nodes one layer out, represent all the dietary supplement interventions that used vitamin C in their intervention. Next, the yellow nodes are the actual study itself. Finally, the pink nodes on the edges are the different medical conditions that were related to the specific study. These are values such as “common cold”, “communicable diseases”, “pneumonia”, etc.
By this graph exploration, we see that the used_in relationship that was created produced meaningful connections within the ontology.
Another relationship set that was looked into for implementing and working with, was that of connecting medical conditions to dietary supplements used in intervention techniques. This connection is significant as it allows us to see what conditions are being related to and treated by certain dietary supplements, which is very much in-line with the project’s overarching goal of dietary recommendations for certain health conditions. What was done to achieve this was the creation of a relationship using Timbr, connecting the dietary_supplement_intervention concept to the browse_conditions concept. Using Timbr’s graph explorer tool, the relationship created could now be visualized, as shown in Figure 6.

As seen above, relationships were created between concepts that show an example of a dietary item used to help with a certain condition. In this example, we see how the relationship conveys that Oral Glucose can be taken to treat Diabetes Mellitus Type 1.
Validation
The main validation of the connection between the two ontologies were queries answering meaningful questions about the data. In order to show that there was a purpose of connecting the ontologies, we can view a complex query below.
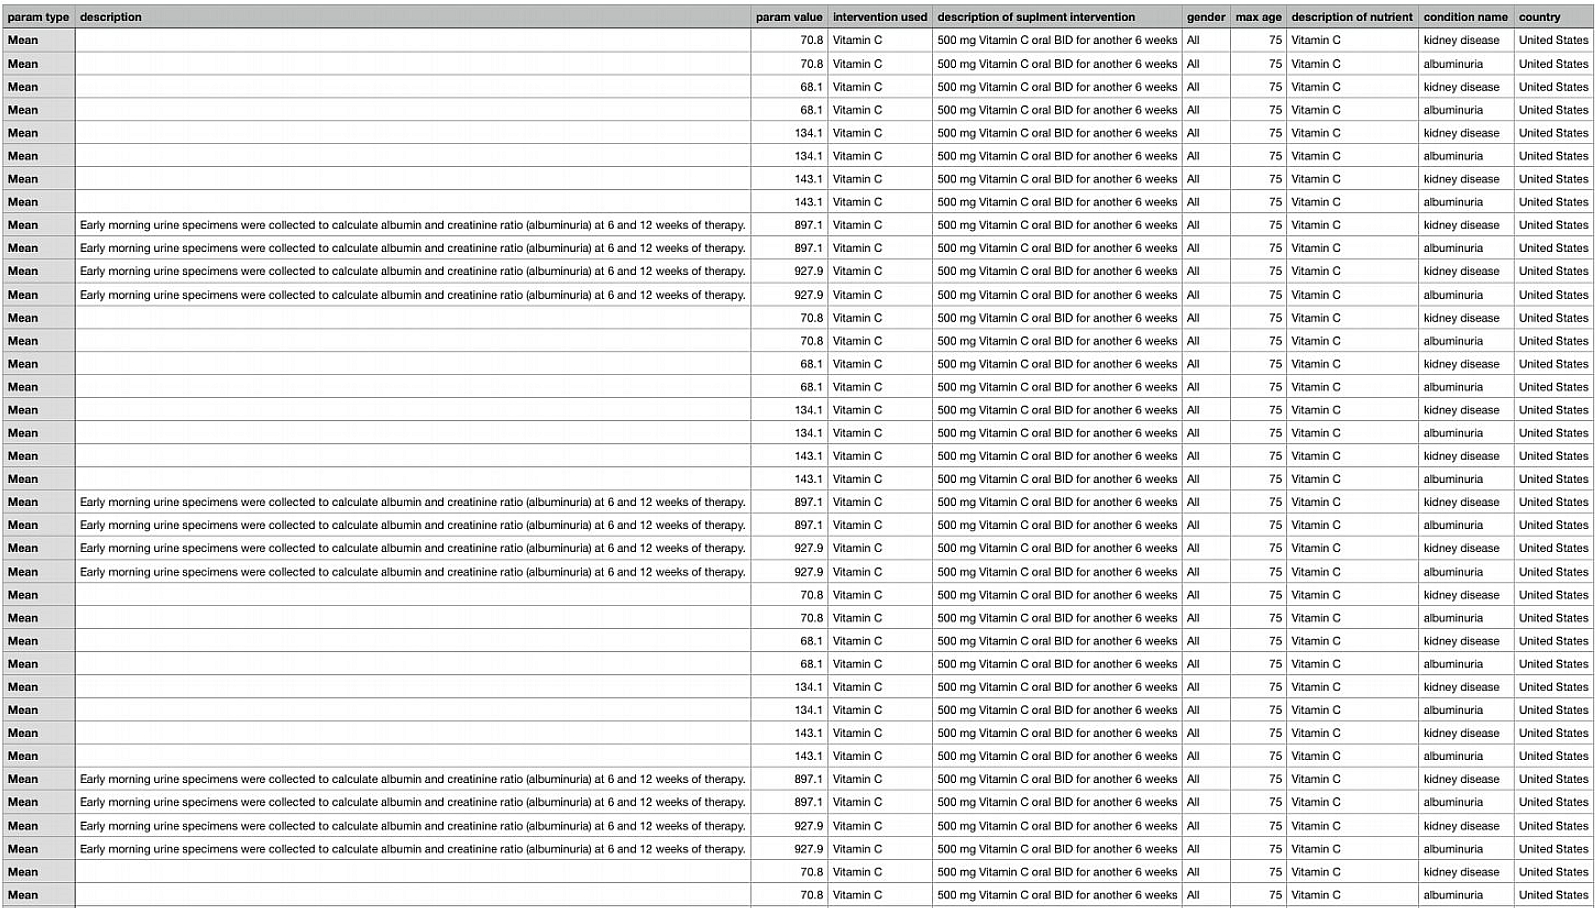
This purpose of this query was to pull up studies for people of a specific age, region, and sex. The query allowed these parameters to be adjusted and bring up all studies relating to these people and the results. The query also pulled up the ingredient used in the study and the foods the ingredient was part of. This allows people to search through studies directly related to them, determine an ingredient they may need or want to mitigate in their diet, helping them find foods to eat. This was a main criterion in the evaluation, to answer meaningful questions connecting the two ontologies.
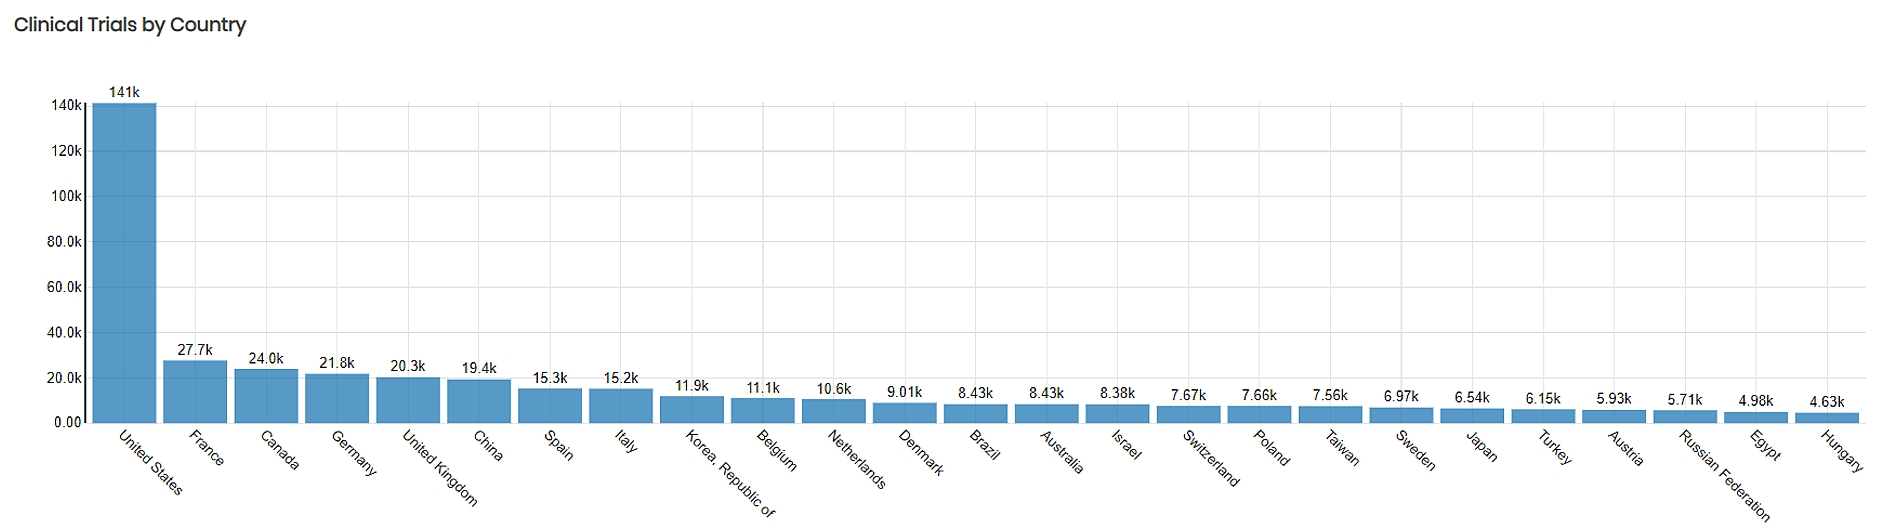
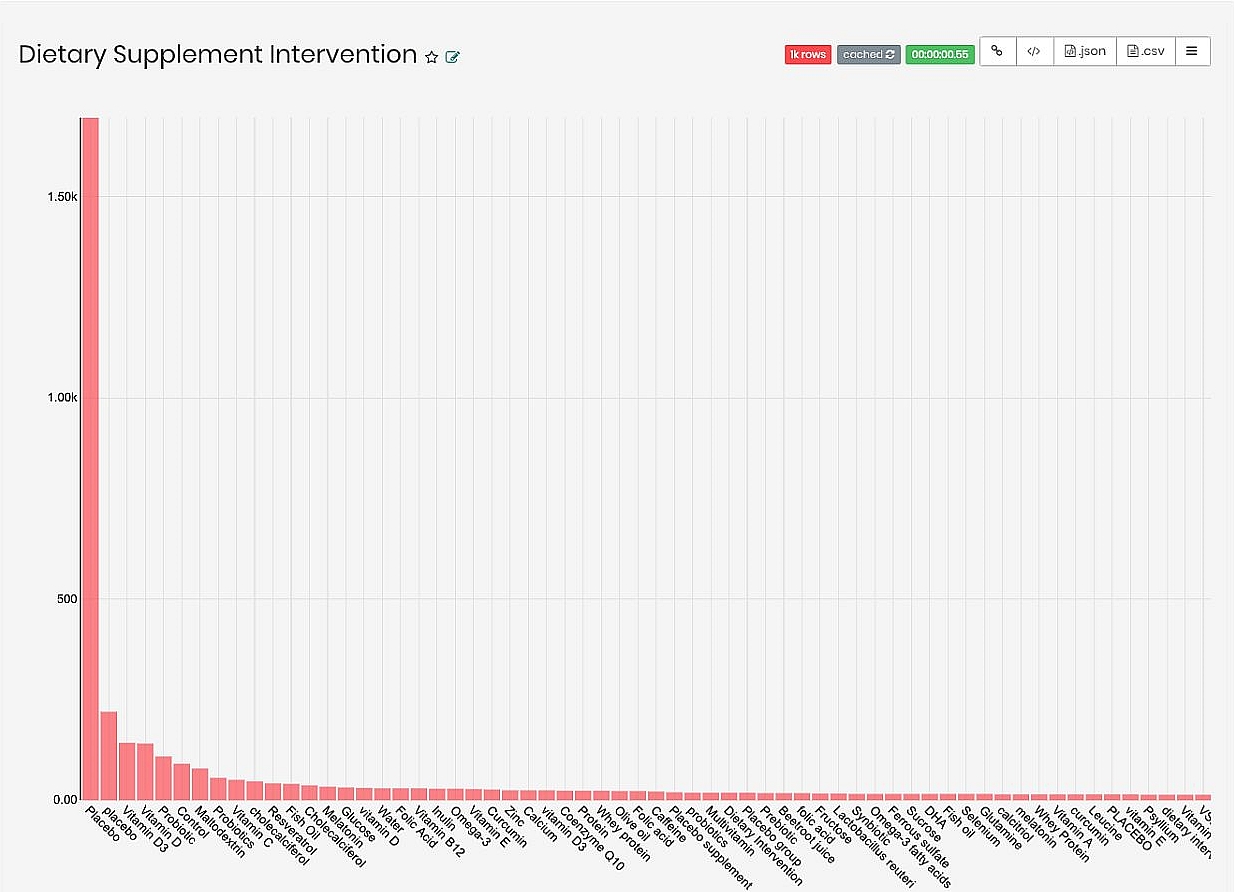
In figure 9 we can get some insight into the strength of our connection. As seen, Placebo is the most common result by far, though if filtered out we can see that there is a fairly small count of studies for each nutrient in the data.
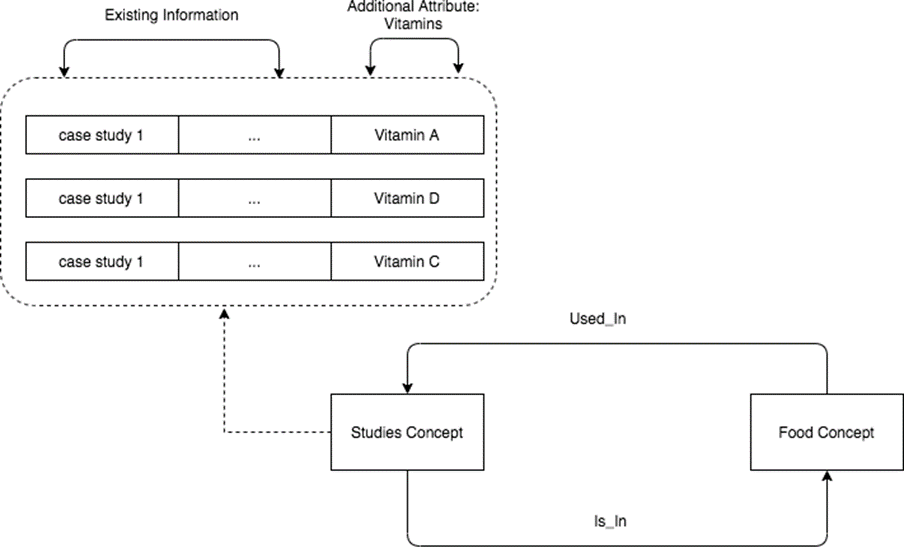
In the process of connecting the clinical trials and food ontologies, some external data processing was required. This data processing was done using a Jupyter notebook that was connected to an underlying Postgres database. Next, a new table was created which would serve as a relationship between the two ontologies. This table contained two values; a nutrient, and the nct_id of a study that mentions that nutrient in the detailed_descriptions table.
In order to verify that this connection was meaningful, the number of matches found was looked at. In the entire clinical trials database, there was data of 358,918 different studies. Of these, 237,639 had entries in the detailed_descriptions table. Of the studies listed in the detailed_descriptions table, 74,315 unique studies were found that mentioned one or more of the nutrients that were looked for. This was 31% of studies from the detailed_descriptions table, and 20% of all the studies.
We believe that this is a meaningful connection because not all of the studies in the clinical trials database deal with foods/nutrition, so matching even 20% of all studies to a nutrient is meaningful in this project.
Ontology Explorer
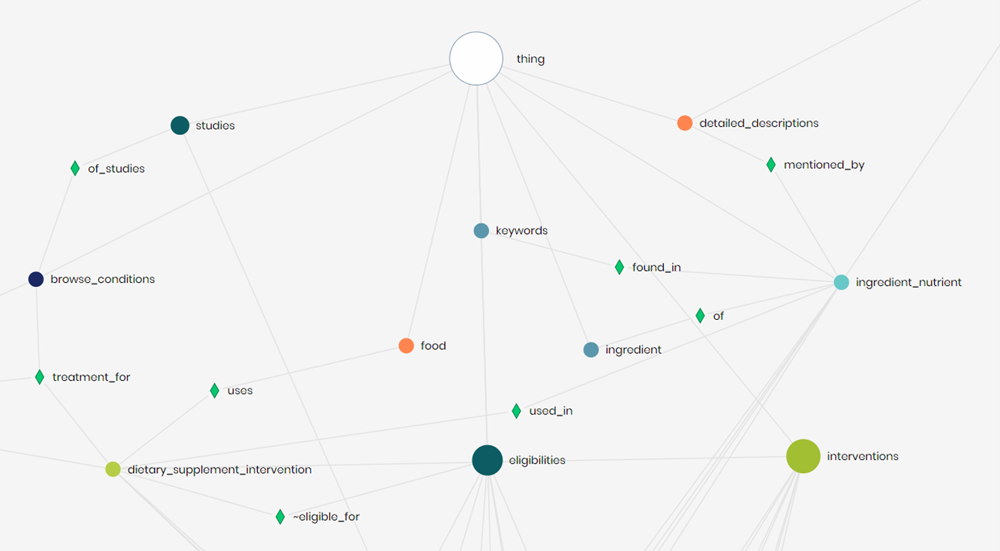
One way of confirming that the relationships created exist was by looking at relationships in the ontology explorer. In the image above, the green diamonds are the relationships between nodes. The food database nodes consist of food, ingredient nutrient, and ingredient. Noticed, was that the most relevant node in the clinical trials database was dietary supplement intervention because it had the most similar data to ingredients (dietary_supplement_intervention >> ingredient_nutrient). Relationships were also added within the clinical trials (browse_conditions >> dietary_supplement_intervention, eligibilities >> dietary_supplement_intervention).
The ontology explorer was a great tool for being able to visualize connections and explore different table objects quickly.
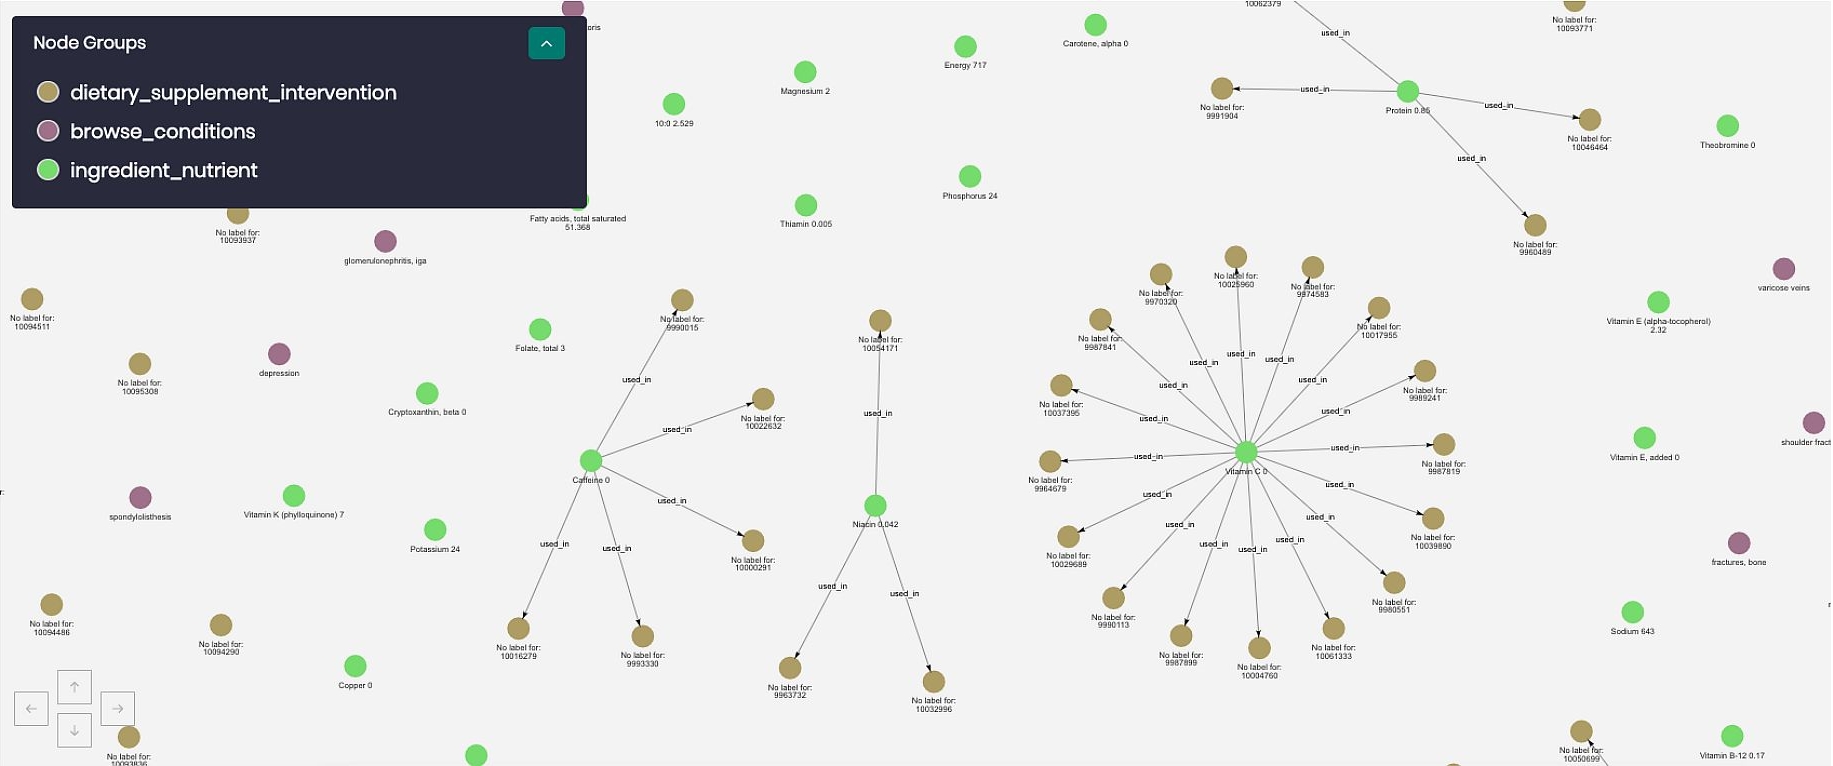
Graph Explorer
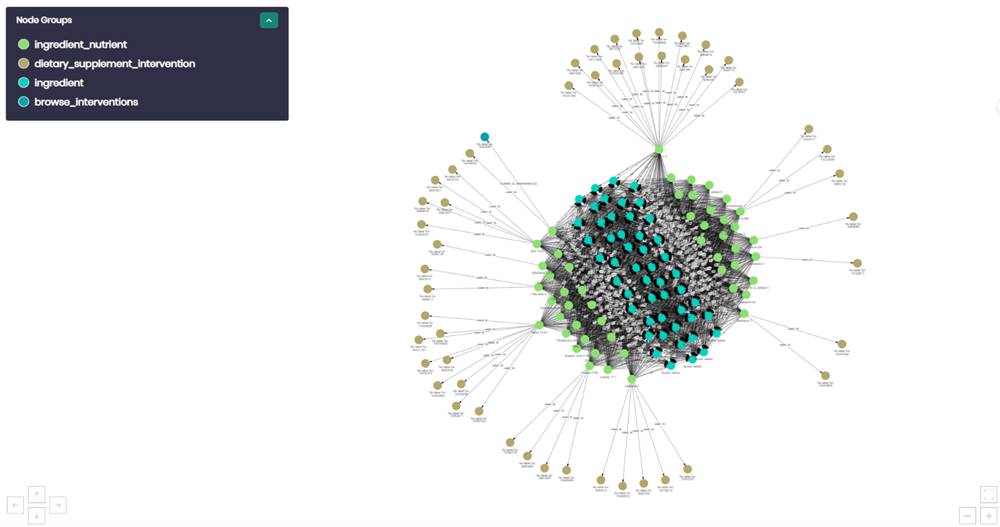
The graph explorer was used to explore various tables as a graph. This feature was used to verify that connections between individual data points in a concept were connected as we expected. In the image above there are 3 types of nodes (blue – food, brown – dietary supplement intervention, green – ingredient). Just by exploring the graph we appreciate that dietary supplement intervention, which comes from the clinical trials database, is connected to food and ingredients which are from the food database. The graph makes logical sense because foods have many ingredients which is why they are clustered in the middle. Each of the ingredients connects to many dietary supplement interventions. This method was used to verify many of the connections that were created between the two databases.
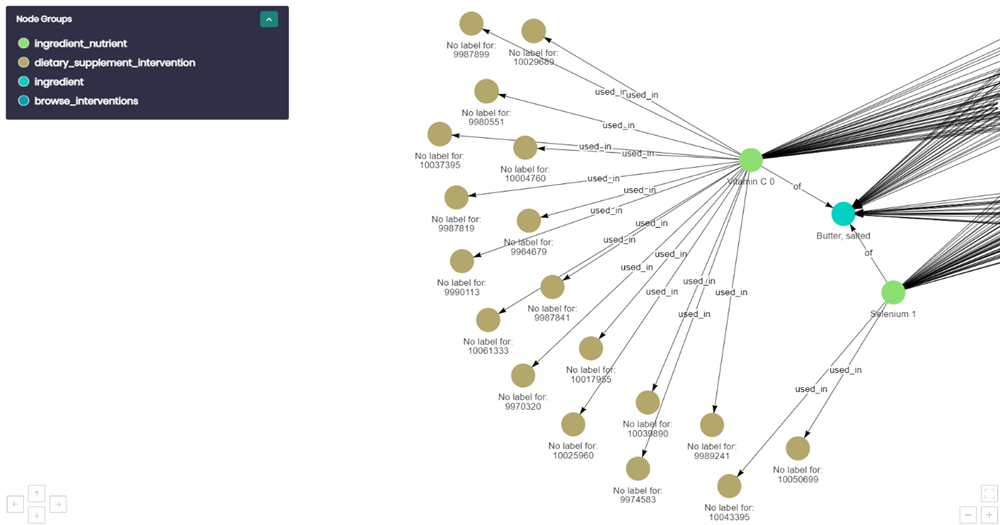
This is a closer look of the previous graph. We see Selenium 1 at the right-middle of the image, that is traced to Butter and also to a brown dietary supplement intervention node. The brown node is a dietary supplement intervention and by using this connection all the other information was attainable from the study that used Selenium 1 as a dietary intervention.
Essentially dietary_supplement_interventions are the gateway between the two databases and once that connection was created, other data could be gathered about the study that would help filter results, ending up with a query result that is meaningful.
Conclusion
With a minor learning curve, university students were able to provide valuable insights from creating and mapping two ontologies to clinical trial studies and food and nutrient studies.
How do you make your data smart?
Timbr virtually transforms existing databases into semantic SQL knowledge graphs with inference and graph capabilities, so data consumers can deliver fast answers and unique insights with minimum effort.