Introduction
Tableau is an interactive, self-service reporting and analytics tool that enables users to integrate and combine data from multiple sources into visualizations and customized dashboards. Creating these visualizations and dashboards with Tableau can be done by technical and non-technical users alike.
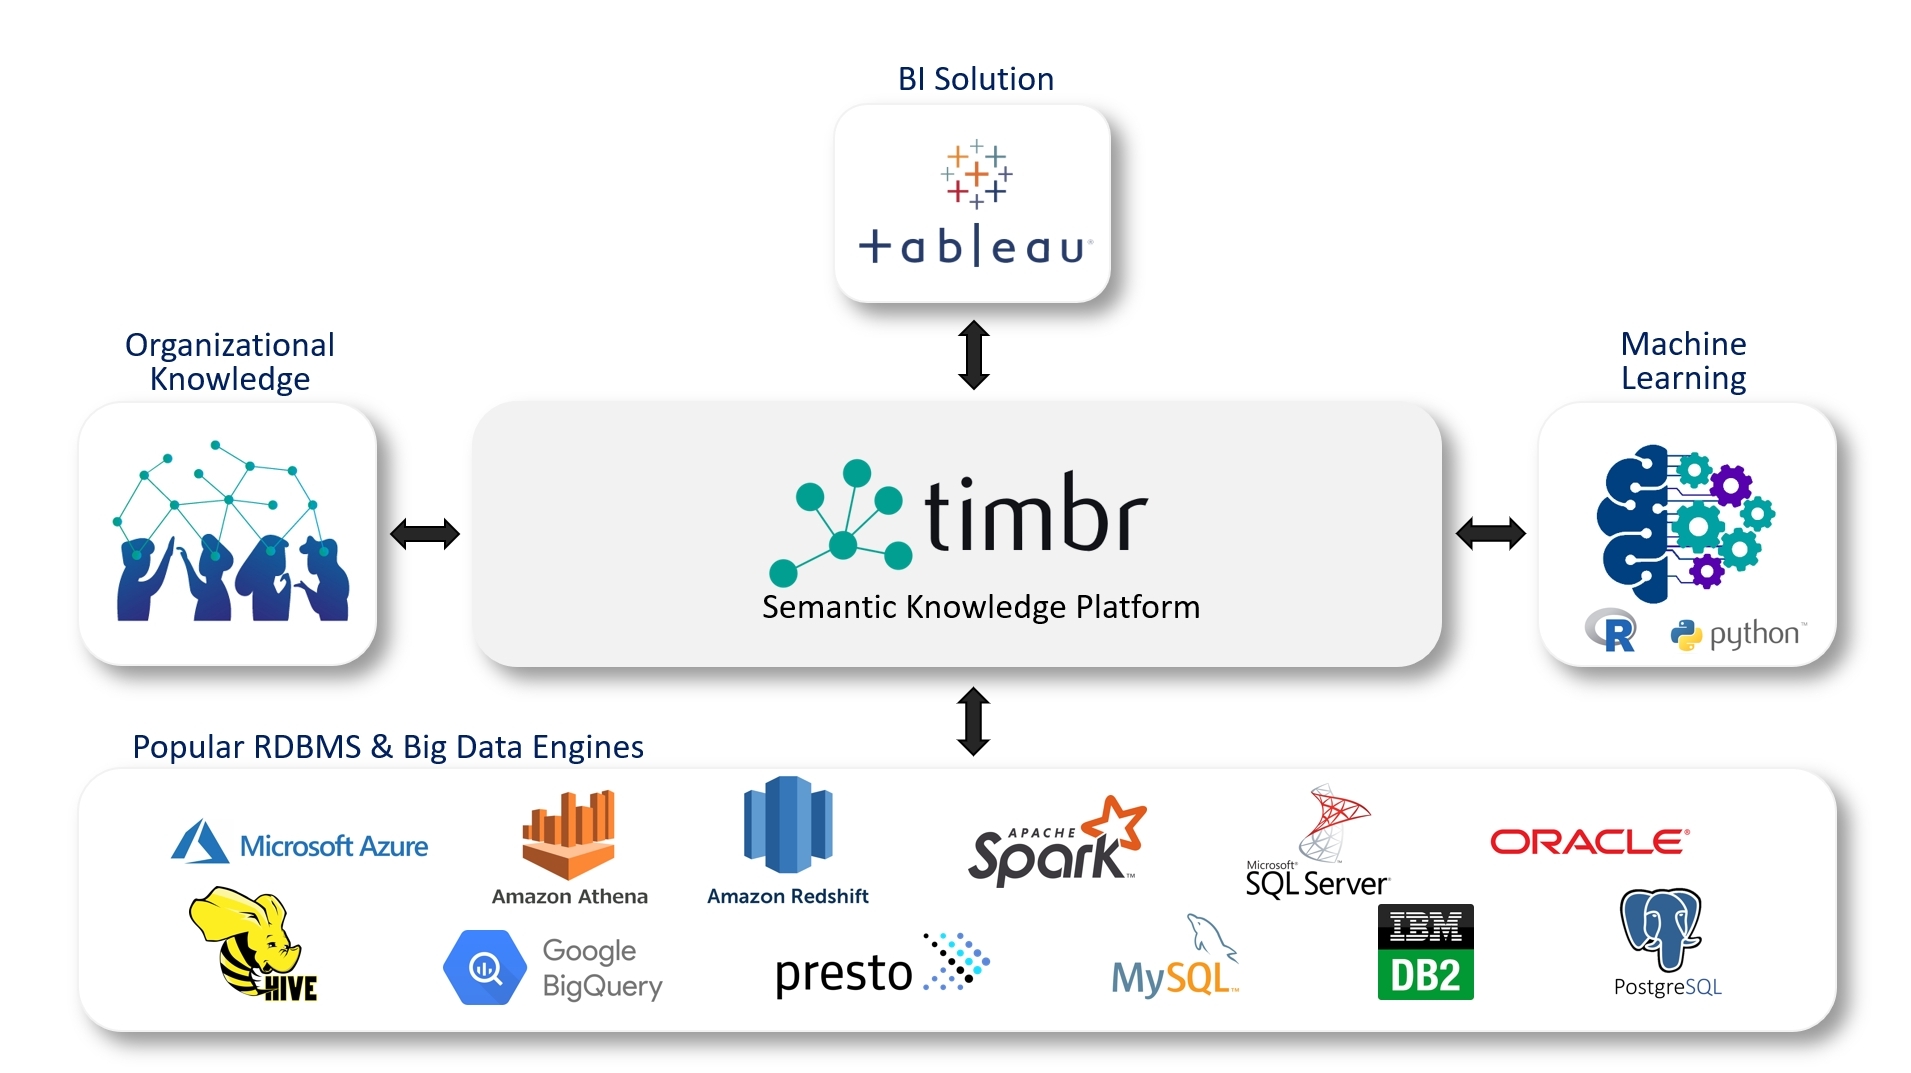
In this blog, we’ll discuss how Tableau users can benefit from advanced and enriched analytics by connecting Tableau to Timbr’s semantic graph layer to access their data sources.
Timbr semantic graph data management platform
Timbr gives data consumers the semantic access they need to better understand the data, discover hidden value, and expose the data without extracting tables or views before running a query.
Timbr’s semantic layer conveniently maps to a wide range of data sources with standard connectors. Users can visually explore and traverse the data as a single connected graph, and they can query it using SQL that is significantly less complex than directly querying the underlying databases as no JOINs or UNIONs are needed.
Timbr also enables graph algorithms in SQL and provides an all-inclusive library to perform graph analytics, automatizing analytical workflows.
Best of all, Timbr is part of the SQL ecosystem so connecting any BI tool such as Tableau is done via standard connectors (JDBC/ODBC).
Enhancing Tableau with Timbr’s semantic graph capabilities
Tableau allows companies to benefit from different forms of data modeling, but it does so for ad-hoc needs. Therefore, a Tableau model is difficult to share across teams, and modeling tasks are repeated at the expense of valuable time.
When modeling data from different sources, such as data lakes, databases, cloud storage, etc., Timbr’s semantic layer provides common meaning as well as hierarchies and classification of data. This enables a common business data model that is accessible to all users, so implementing visualizations in Tableau becomes a simpler task and prevents repetitive modeling work.
Some benefits of using Timbr include:
- Users’ response time is shortened, as time is spent on producing reports rather than on exploring and preparing data.
- Changes to the data model automatically reflect on the report. For example, adding/removing data from new sources is managed in Timbr’s data modeler, without the need to alter or edit the report.
- The semantic model can be shared across the organization for re-use by other Tableau users and in applications other than Tableau.
Another benefit to Tableau users is the creation of reports or dashboards that require complex SQL queries. Timbr greatly simplifies these queries by taking advantage of the semantic layer that represents the data. Users query the semantic concepts that represent the data and embed relationships and logic, so there’s no need for JOIN and UNION statements.
Connecting Tableau to Timbr
Before we jump into Tableau and take a look at examples of analytics delivered with the help of Timbr, let’s see the behind-the-scenes of Timbr to understand how the knowledge graph sets us up for an easy task when attempting to create visualizations.
Timbr‘s features of inheritance, transitivity, business rules and relationships, are made possible by an ontology, which can be thought of as the schema of a knowledge graph. The ontology is a representation of the conceptual model of the business or use-case using a categorized, networked structure of nodes called concepts. Each concept stands for a business term such as: Person, Place, Customer, Car, Country, Product, Event, etc. Concepts represent the underlying data to provide the organization with a common vocabulary that enables easy access and sharing of information.
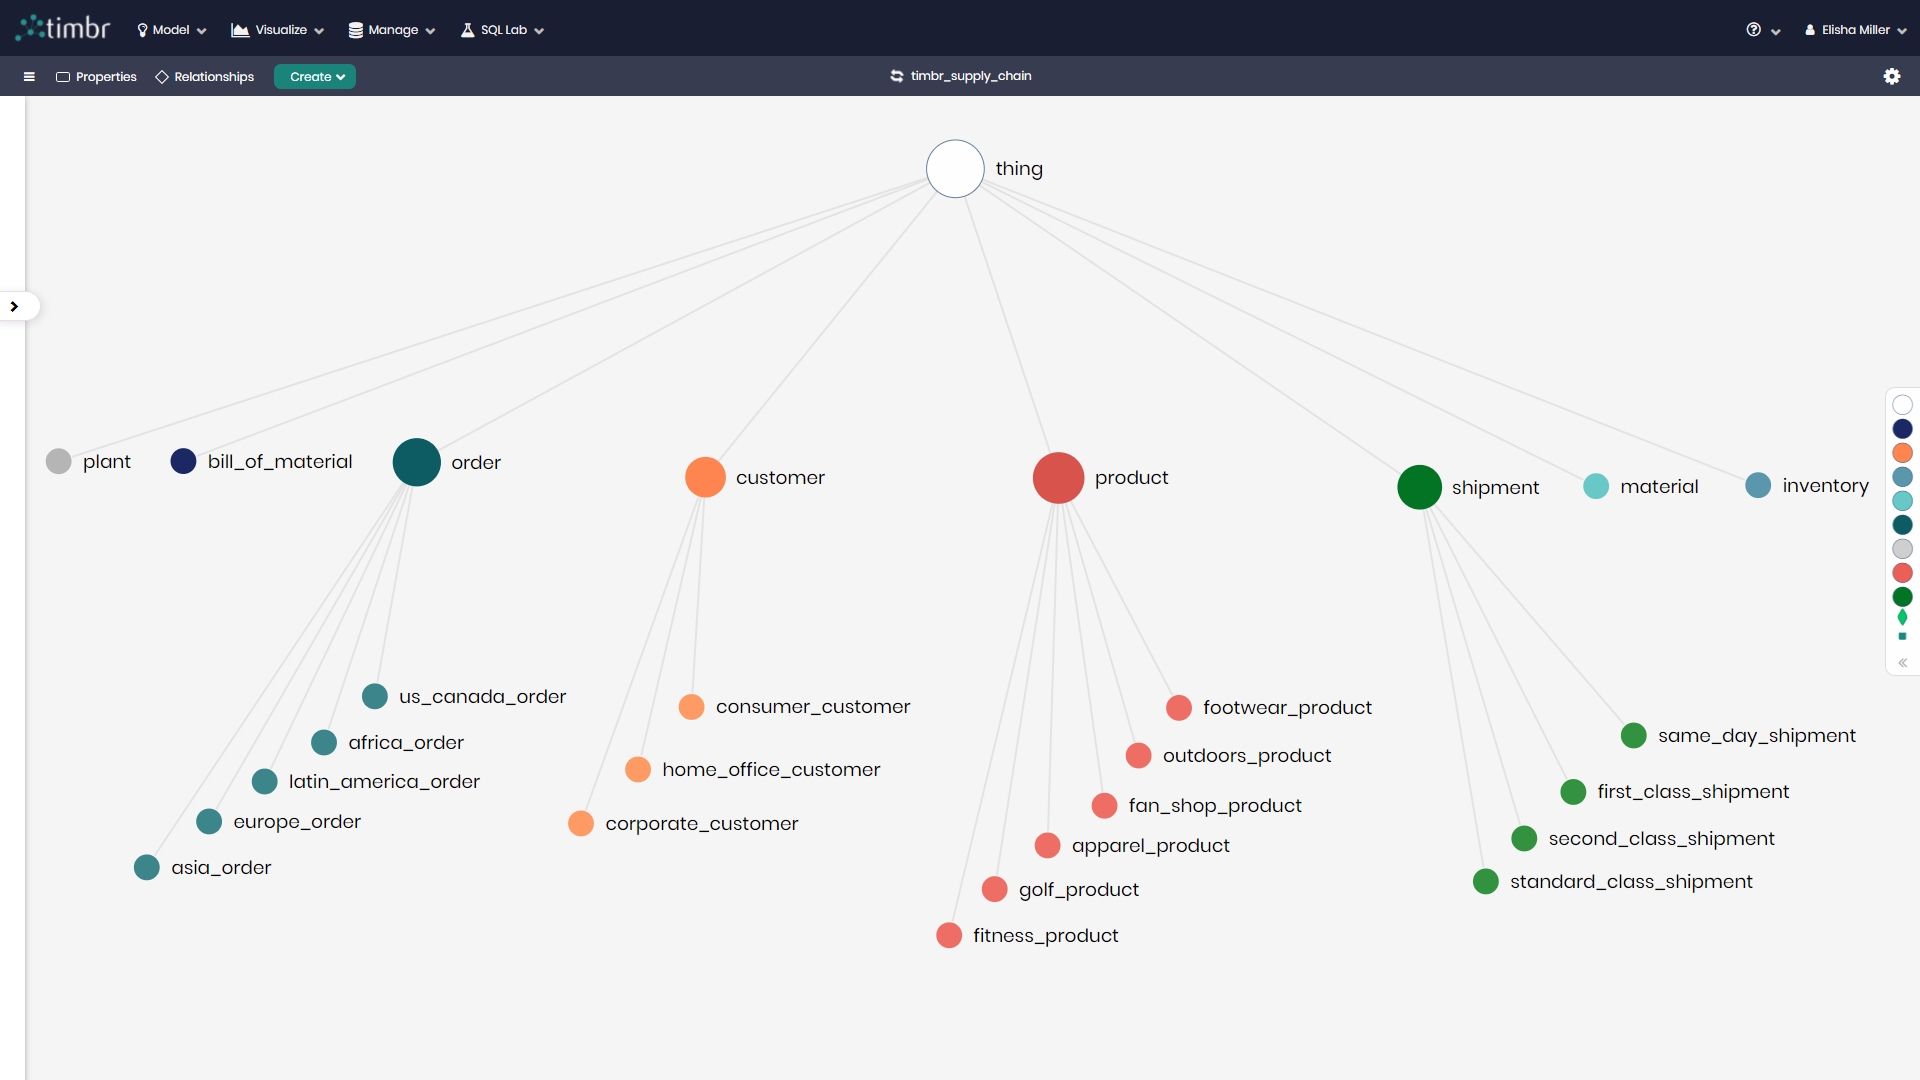
Here is the ontology model that was created for the “Supply Chain” knowledge graph used to create the visualizations in Tableau that we will see shortly:
In the image above we see the concept’s hierarchies and classifications.
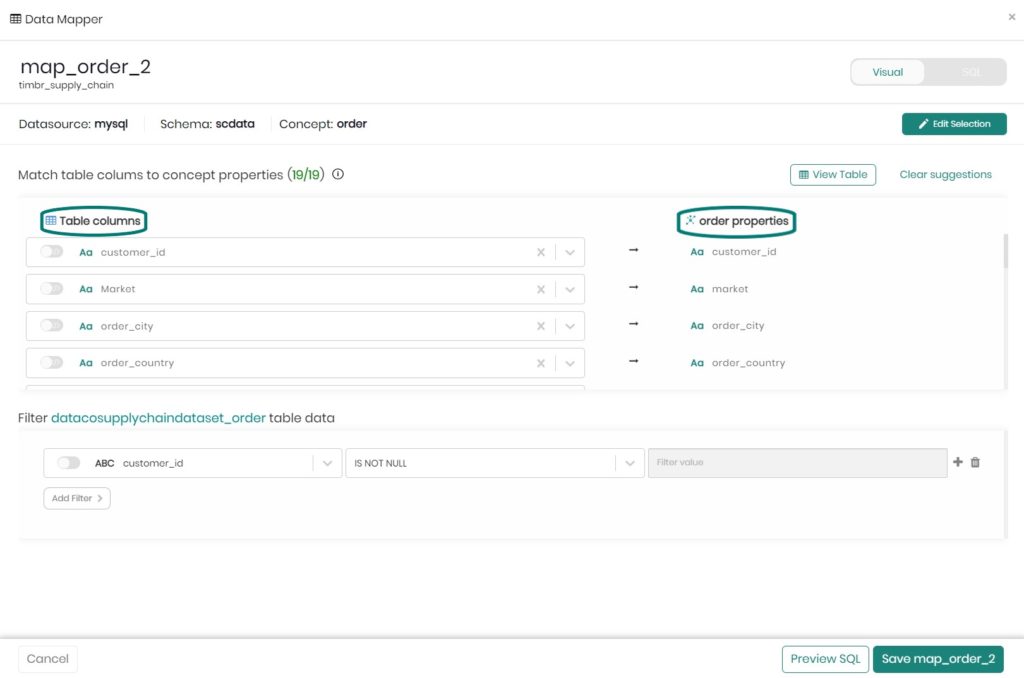
Timbr enables convenient and fast mapping of data sources to the ontology’s concepts so that each concept becomes a virtual table that represents one or more tables of the underlying data. The properties of each concept represent the table column names of the data. To understand this let’s look at the following mapping example in Timbr’s visual data mapper:
Once the data is mapped, relationships are created using the properties of a concept matching them with properties from a different concept. Timbr enables SQL queries of concepts instead of directly querying the data sources and by doing so it dramatically reduces the complexity of queries.
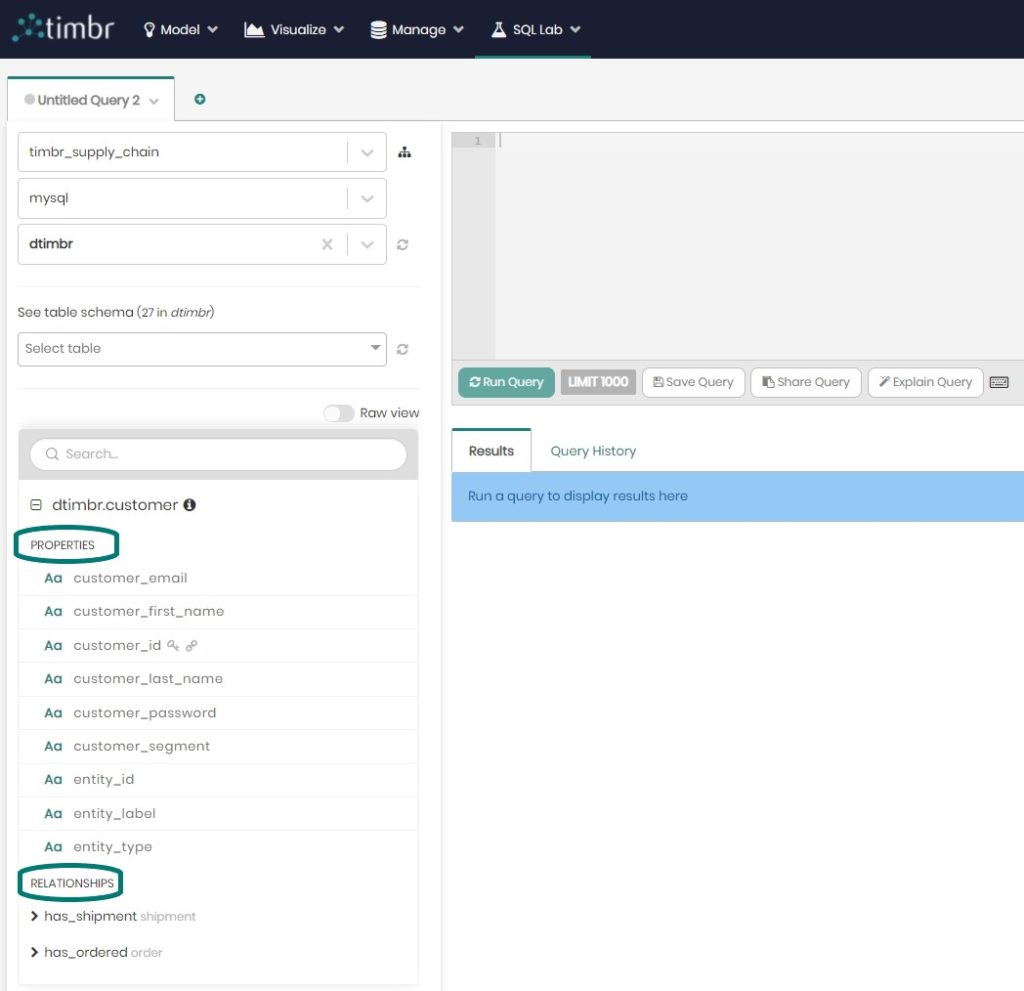
For an SQL user, the properties and relationships of a given concept appear as virtual tables and columns as seen here:
So, now that we understand how the Timbr knowledge layer is built and connects our data together, let’s see how it can help Tableau users gain unique insights that are quite difficult to obtain otherwise.
Fast delivery of complex insights with Tableau connected to Timbr
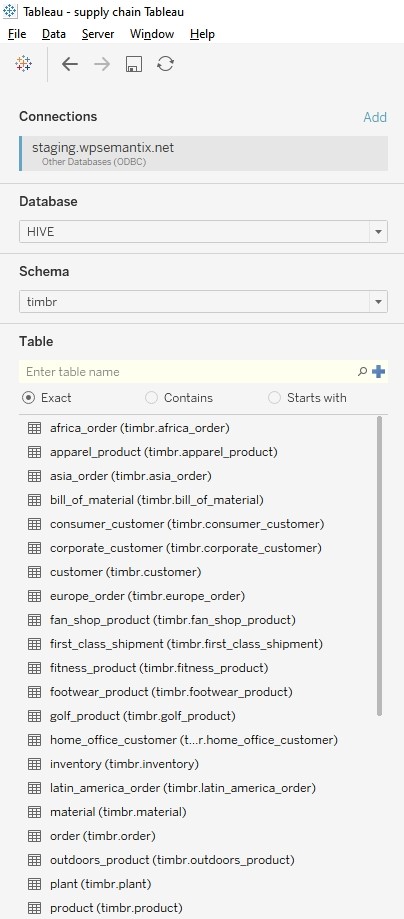
Once we simply connect to Tableau using a Hive ODBC Connector, we can begin to create visualizations and dashboards and really utilize Timbr’s knowledge graph capabilities in a number of ways without having to upload any data.
One option we can use when creating dashboards is to simply drag and drop concepts into different visualizations as the concepts appear in the knowledge graph model.
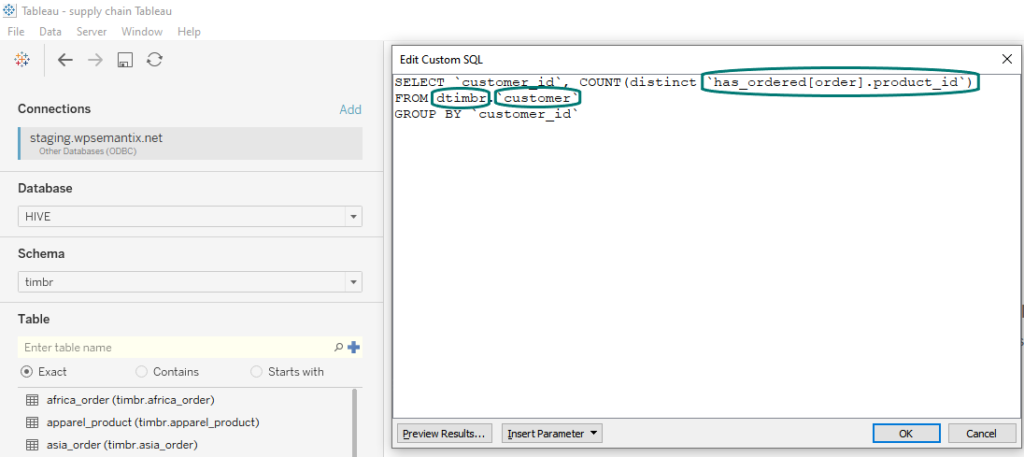
Another option is to create a customized SQL query, which in Timbr’s case can leverage graph traversals in standard SQL. So for example, if we wanted to visualize which customers order multiple products, we can run the following SQL statement in Tableau:
In this custom SQL query, we can clearly see the relationship called `has_order` which is used to connect between concept order and concept customer. We are able to connect between concepts and their underlying data using Timbr’s virtual schema for relationships called `dtimbr`, without the need for any join or union statements.
The third option we will touch on is for users who may want more than drag and drop knowledge graph concepts as they appear, or standard custom SQL. Perhaps users want to create many different calculations above the knowledge graph and use them in Tableau, instead of the users creating custom SQL’s every time they intend on querying, they can take advantage of Timbr’s Semantic Views.
Timbr has created a virtual schema for views called `vtimbr`, allowing users to create denormalized or aggregated views of their data that can be viewed and accessed at any time, thus taking advantage of cached query capabilities that greatly enhance performance speeds and time to value.
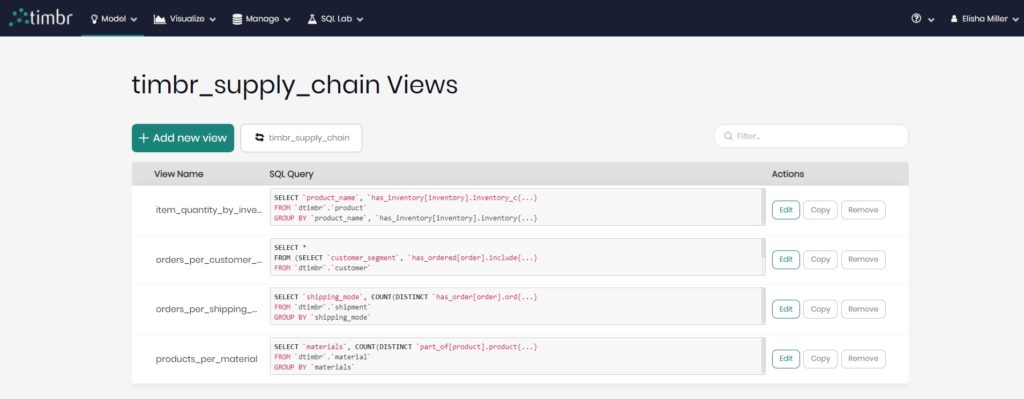
Here is a look at some of the views created for the supply chain knowledge graph:
Once these views are created, users can drag and drop them into visualizations or enter these views as custom SQL queries and begin to create their intended dashboards in no time.
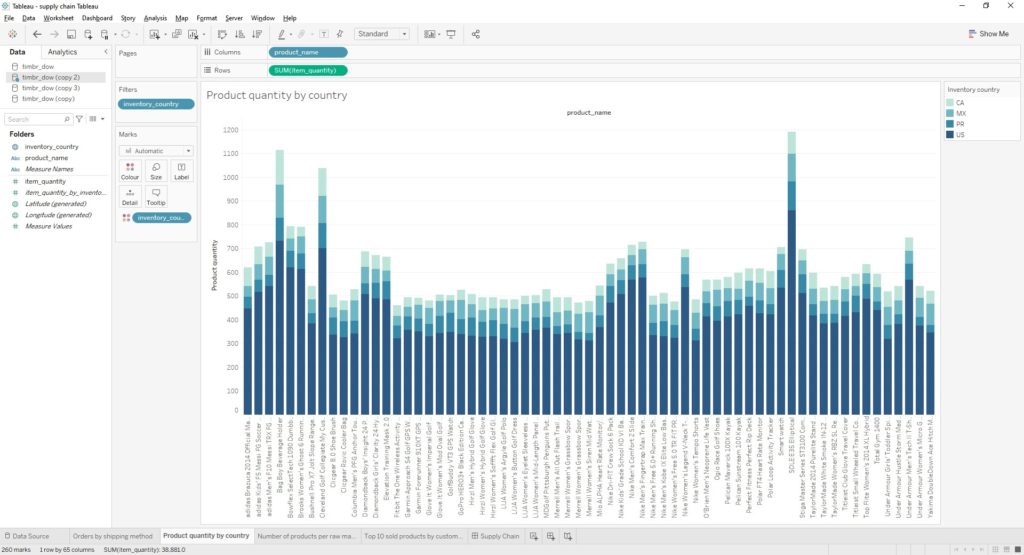
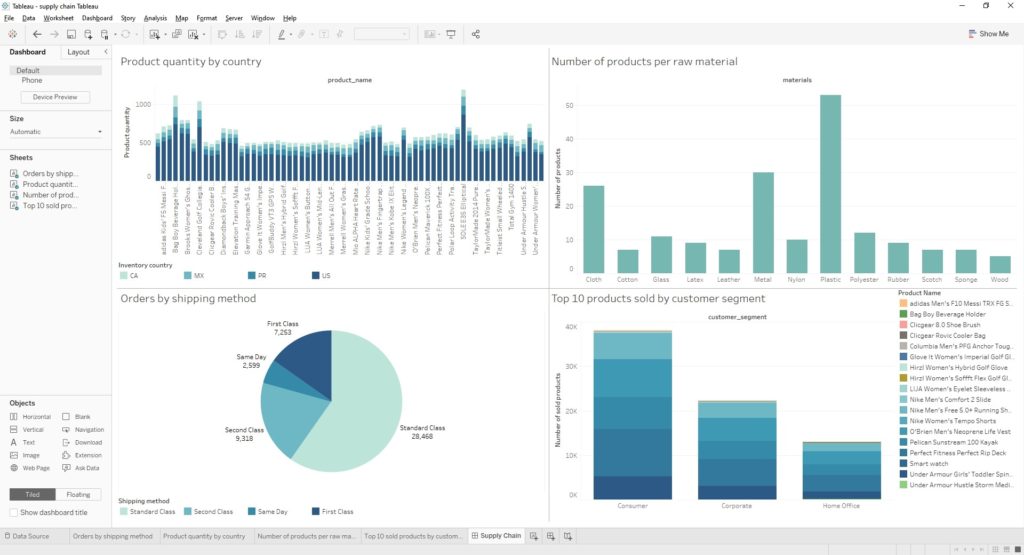
We wanted to put our semantic views to the test and decided to create a dashboard using four different views that we’ve created. The first view was created and used in a visualization in order to present different product quantities in the different countries they reside in.
The visualization returned as follows:
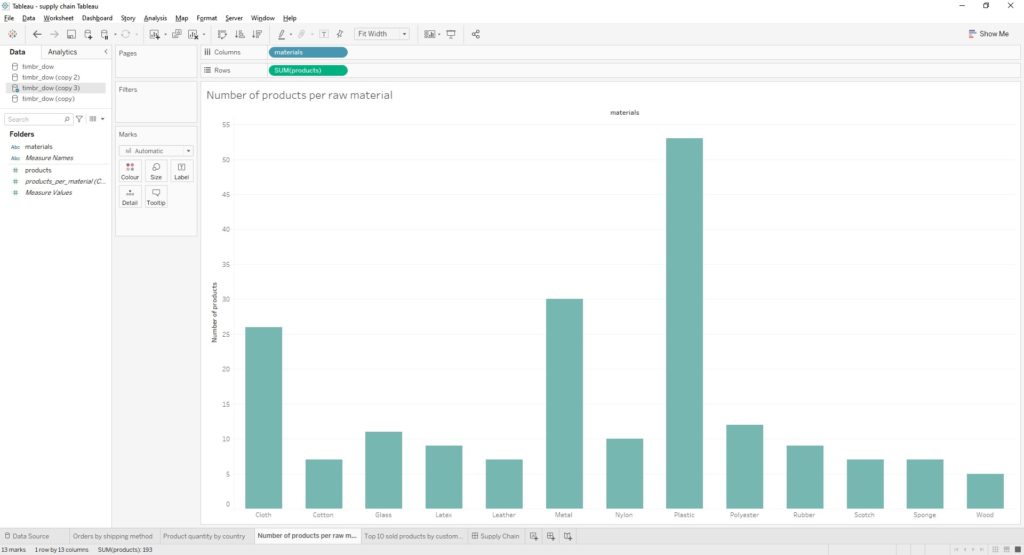
Our second view was created in order to help us visualize the number of products that were created from the numerous raw materials that exist in the supply chain.
Here is the visualization:
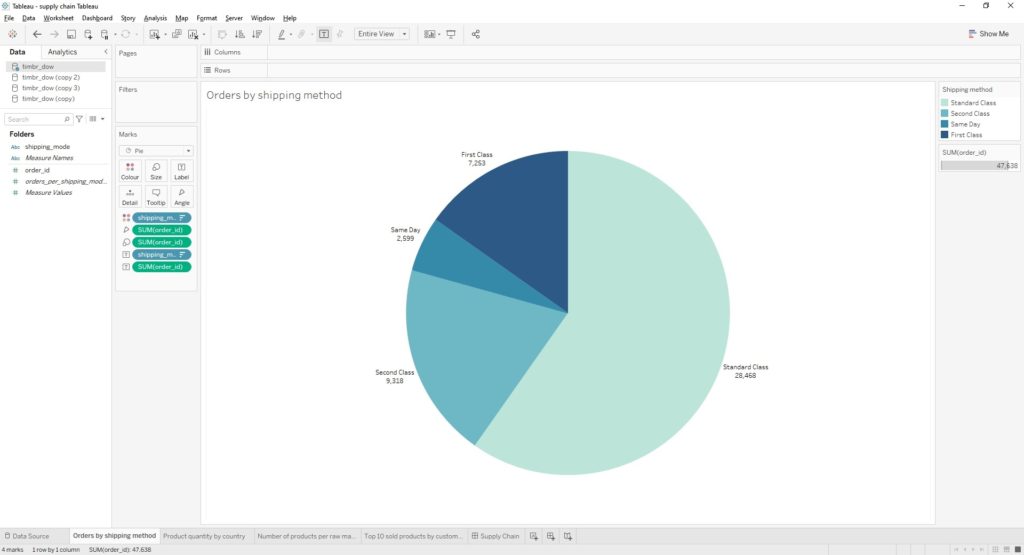
Our third view was created in order to help us visualize the number of orders based on the different shipping methods that exist.
Here is the result:
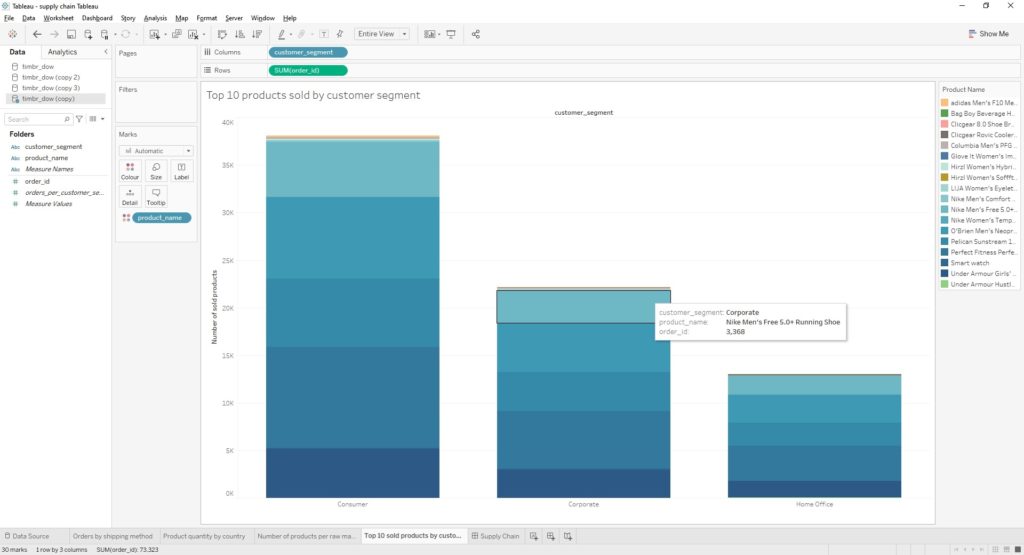
Our fourth and final view was created in order to help us visualize the top 10 products sold based on customer segments.
Here is the visualization:
Just like that in no time, we were able to create 4 views from simple and shortened SQL, enabling us to create visualizations for our supply chain dashboard that can be seen here:
Conclusion
The Timbr semantic graph data management platform adds advanced semantic capabilities, turning Tableau into a user-friendly strategic tool that delivers unique insights and shortens time to value. Organizations can benefit from convenient and live access to data remotely. Data consumers can easily understand, explore and query the data by means of concepts, instead of dealing with a large number of tables and columns, doing so at record times.
Click here to test drive Tableau with Timbr. Set up in just a few minutes and begin semantically enhancing your data.
How do you make your data smart?
timbr virtually transforms existing databases into semantic SQL knowledge graphs with inference and graph capabilities, so data consumers can deliver fast answers and unique insights with minimum effort.

