Introduction
Power BI is the highly popular business analytics service by Microsoft. It provides interactive visualizations and business intelligence capabilities with an interface simple enough for end-users to create their own reports and dashboards. Power BI supports a number of connectors, adapters and drivers that connect to a variety of data sources such as apps, services, or even data in the cloud.
Connecting Power BI to a standard relational database is a simple task, but what happens when we need to connect large volumes of data distributed among varied sources and in different formats? To access data, many users may prefer using the import data option instead of querying the sources remotely, as it seems like the easier route to take, but importing data to Power BI is limited by the user’s memory (RAM). Moreover, the Power BI file size imported can’t be larger than 1 GB, which leaves the user with the options of minimizing the file size or upgrading to Power BI premium which allows files up to 50 GB. That’s OK but, what about conveniently querying larger data volumes?
Another significant challenge faced by Power BI users is dealing with big data. Making sense of large, inter-related and varied amounts of data simultaneously connected to Power BI is a very complex task. Power BI is good at handling simple relationships between tables in a data model. But, if there are complex relationships between tables, that is, if they have more than one link between tables, Power BI might not handle them well. Users need to create a data model carefully by having more unique fields so that Power BI does not confuse complex relationships.
Lastly, after dealing with the previous challenges, Power BI can’t do advanced graph analytics that provide unique insights about the data. Or can it?
Timbr Semantic Graph Platform
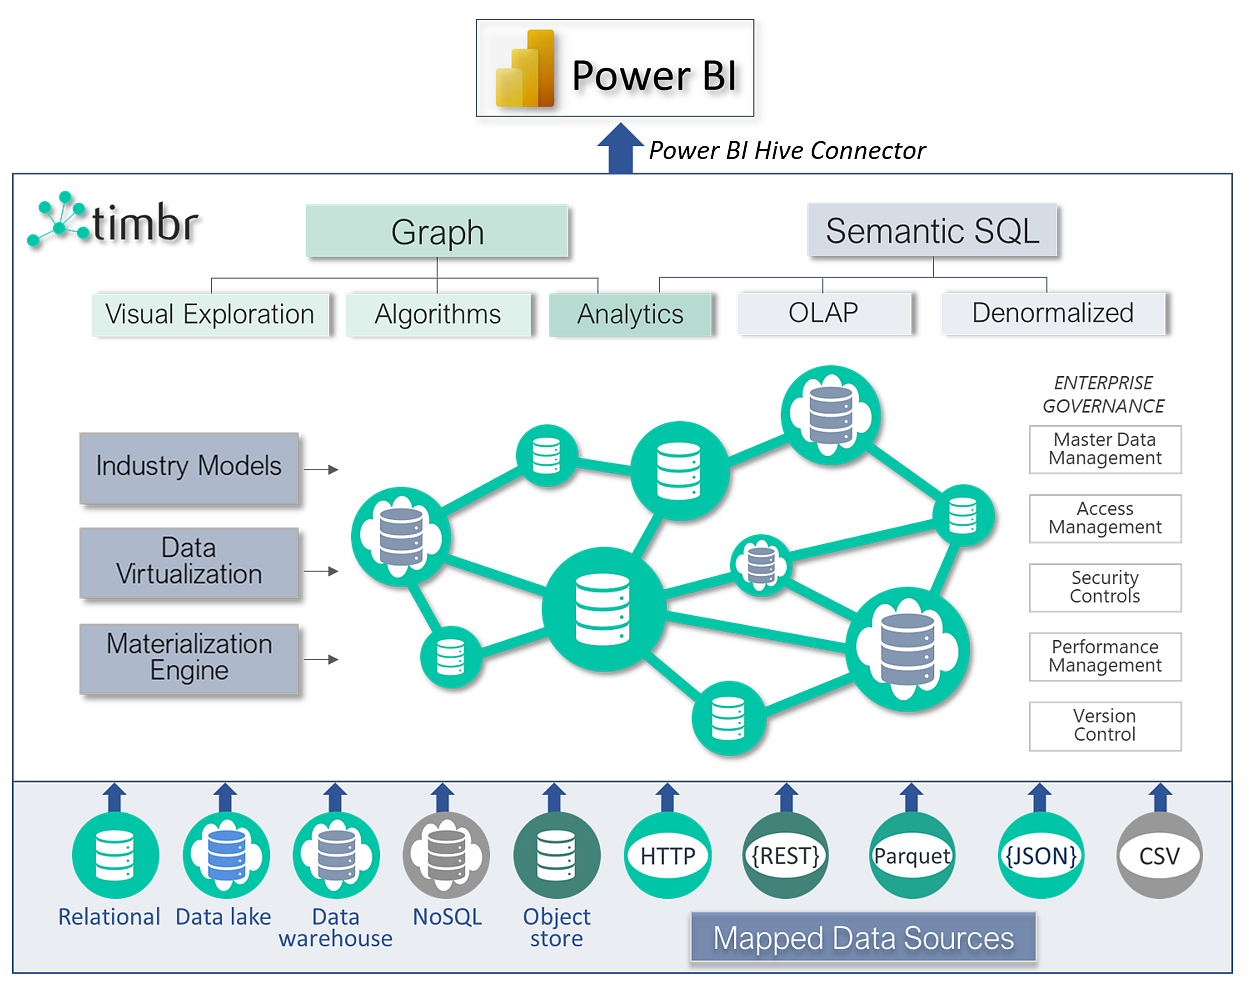
Timbr is integrated into a collaborative, AI-enabled platform that connects to all popular BI tools and to most common databases and sources of data, to give data consumers the semantic access they need to better understand the data, discover hidden value, and expose the data without extracting tables or views before running a query.
Timbr’s semantic layer conveniently maps to a wide range of data sources with standard connectors. Users can visually explore and traverse the data as a single connected graph, and they can query it using semantic SQL code that is significantly less complex than direct SQL queries of the underlying databases.
Timbr also supports graph algorithms directly over relational databases and provides an all-inclusive library to perform graph analytics and automatize analytical workflows.
Best of all, Timbr is part of the SQL ecosystem so connecting any BI tool such as Power BI is done via standard connectors.
Connecting Power BI to Timbr
By connecting Power BI to Timbr instead of connecting directly to the data sources, users gain the following major advantages:
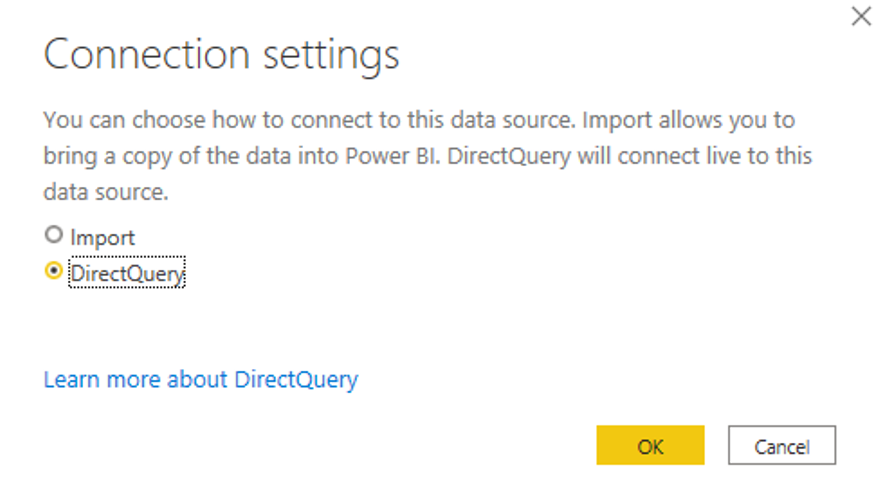
- Timbr leverages the Hive connector that supports both the “Import” option and “Direct Query” option, allowing users to work with large amounts of data directly across the knowledge graph, not being limited to working with imported data only.
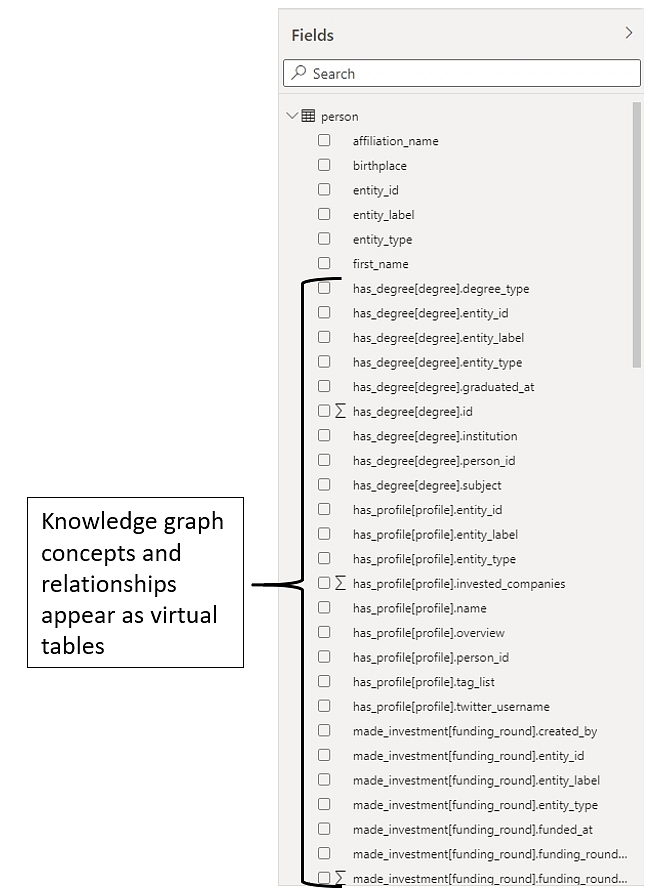
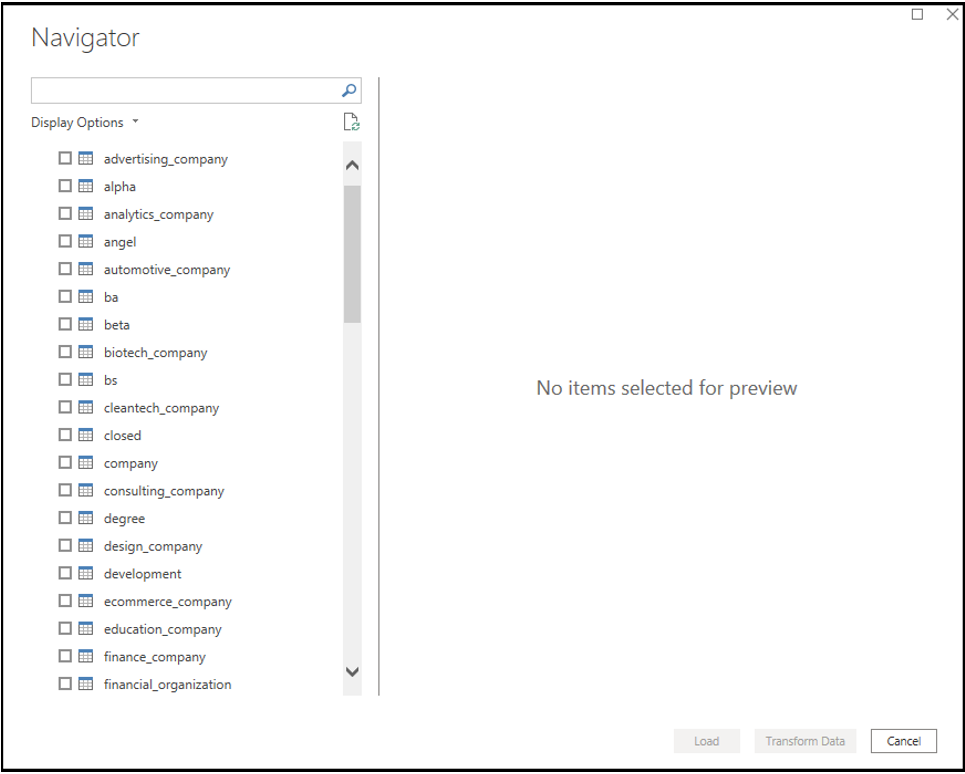
- Timbr’s knowledge graph concepts and relationships appear as virtual tables in Power BI. This allows users to create complex visualizations with ease, taking advantage of the knowledge graph capabilities which include inheritance, transitivity, business rules and relationships.
- Timbr provides graph analytics libraries that can be accessed from Power BI to deliver advanced analytics such as recommendations.
How Timbr automates Power BI workflows and enables advanced analytics
Before we take a look at examples of analytics delivered with the help of Timbr, let’s see the behind-the-scenes of Timbr to understand how the knowledge graph sets us up for an easy task when attempting to create visualizations.
Timbr’s features of inheritance, transitivity, business rules and relationships, are made possible by an ontology, which can be thought of as the schema of a knowledge graph. The ontology is a representation of the conceptual model of the business or use-case using a categorized, networked structure of nodes called concepts. Each concept stands for a business term such as: Person, Place, Customer, Car, Country, Product, Event, etc. Concepts represent the underlying data to provide the organization a common vocabulary that enables easy access and sharing of information.
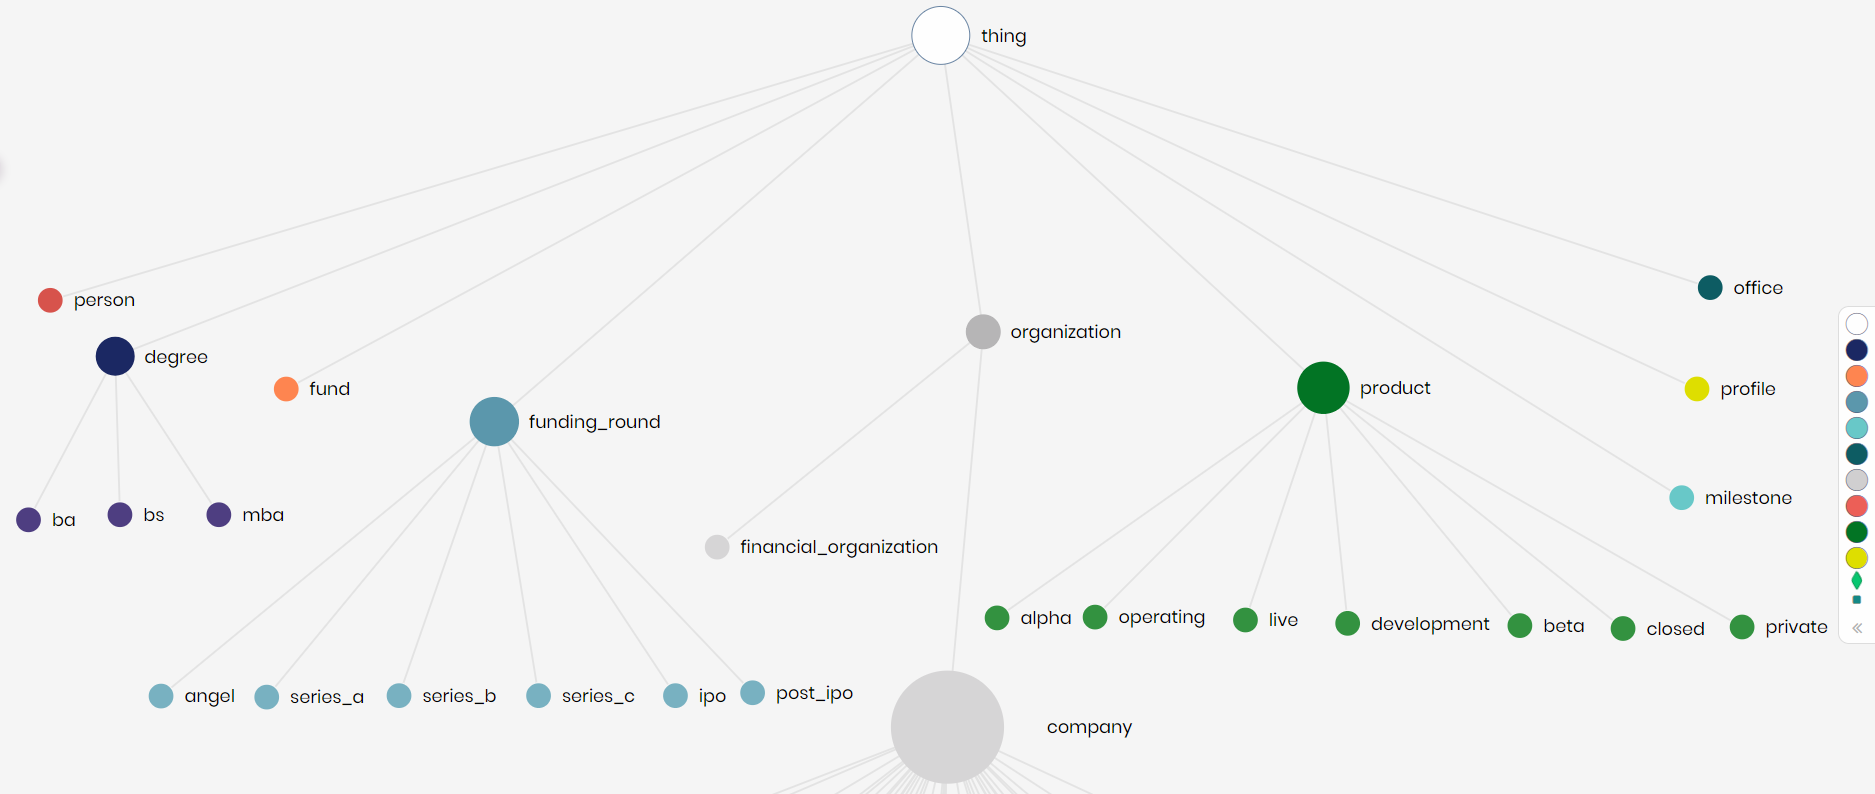
Here is an example of an ontology that was created for the “Crunchbase” knowledge graph:
In the image above we see the concept’s hierarchies and classifications.
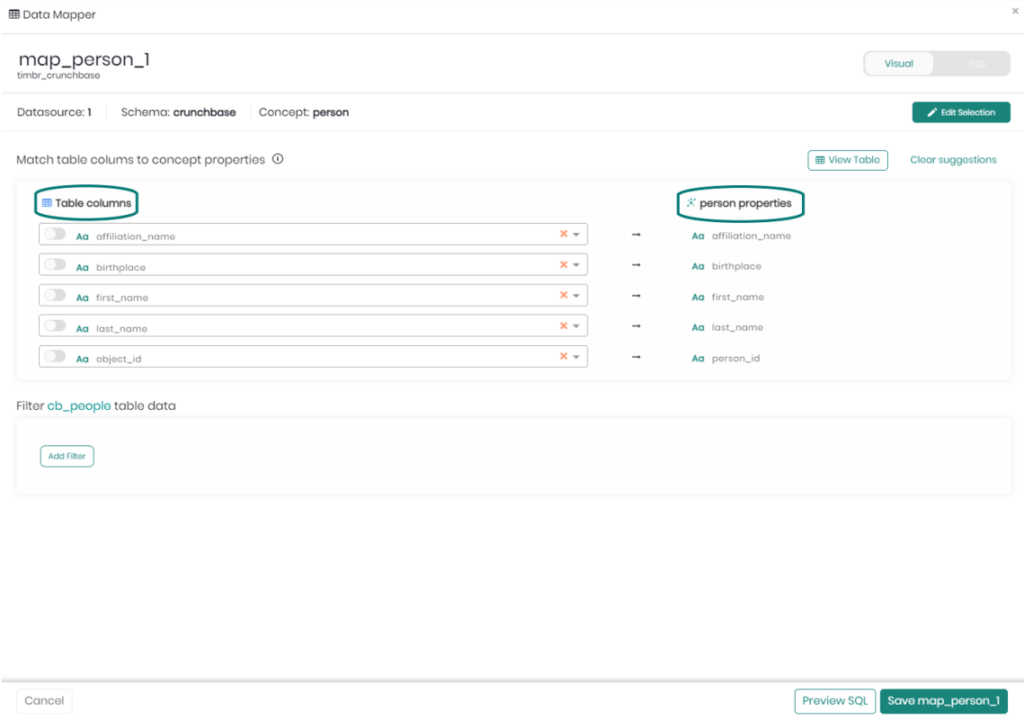
Timbr enables convenient and fast mapping of data sources to concepts, so that each concept becomes a virtual table that represents one or more tables of the underlying data. The properties of each concept represent the table column names of the data. To understand this let’s take a look at the following mapping example:
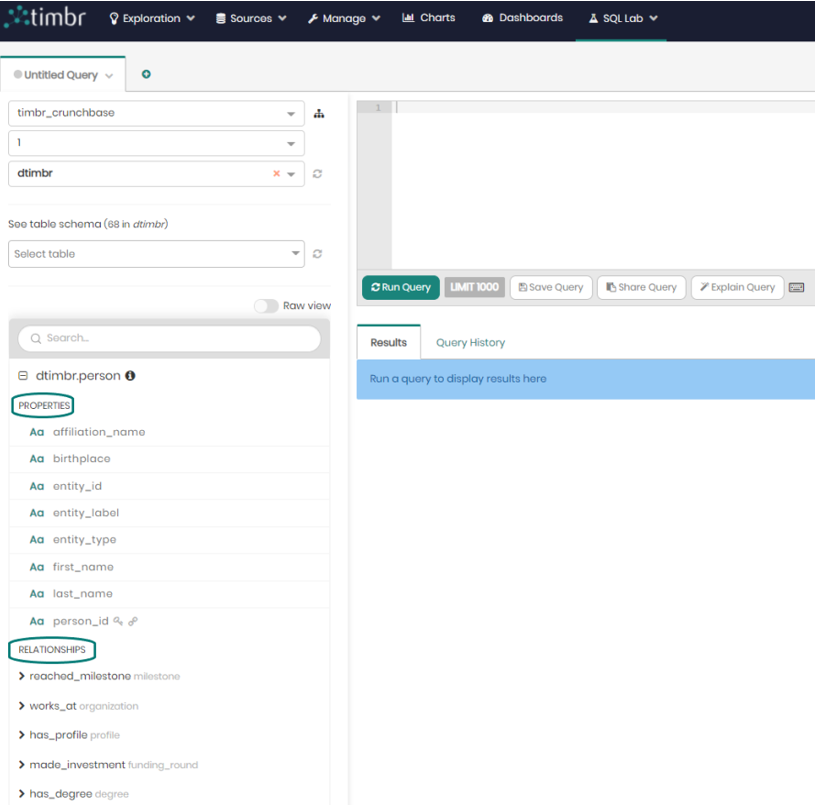
Once the data is mapped, relationships are created using the properties of a concept matching them with properties from a different concept. timbr enables SQL queries of concepts instead of directly querying the data sources and by doing so it dramatically reduces the complexity of queries, because there’s no need of Join and Union statements. For a SQL user, the properties and relationships of a given concept appear as virtual tables and columns as seen here:
So, now that we understand how the Timbr layer is built and connects our data together, let’s see how it can help Power BI users gain unique insights that are quite impossible to be obtained otherwise.
Fast delivery of complex insights with Power BI connected to Timbr
Once Power BI is connected to Timbr, we select the concepts that we are interested in to create our visualizations.
What would usually happen now when connecting a relational database, is that we would need to start creating relationships between the different tables. When connecting Power BI with Timbr we get the relationships “built in” already, so that when it is time to create visualizations our list of column names that are usually just column names now have relationships that appear as virtual columns.
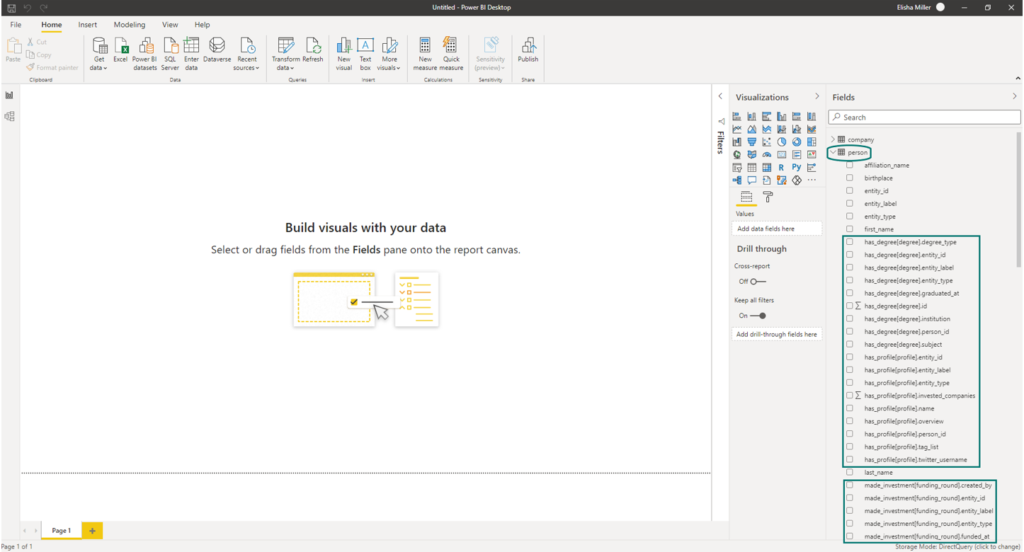
Power BI connected to Timbr looks as follows:
From the image above we see that once we choose the concept Person from the “CrunchBase Knowledge Graph”, concept Person appears as a virtual table where its properties have both the regular virtual columns but also the virtual columns that are the relationships. So, in this example we can see the relationships connecting concept person to the concepts: degree, profile and funding round, which are all in the parentheses.
Now that our desired concepts are ready with their properties and relationships let’s create some visualizations.
Visualization #1 (Using relationships as virtual columns)
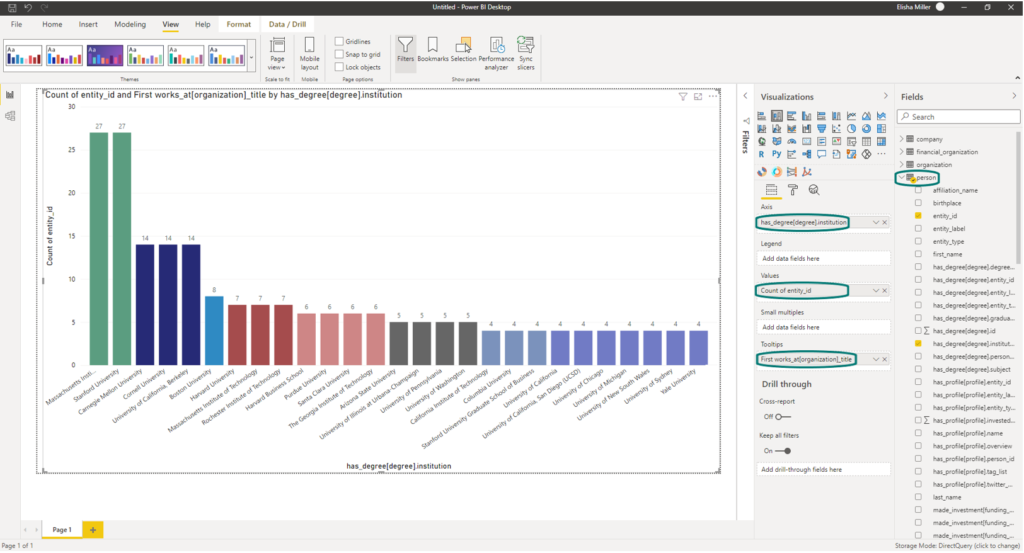
We begin by creating a bar chart that shows the leading institutions that produced the most engineers from the CrunchBase data set, including the exact number of engineers produced.
To do so, we use the person concept and bring in a relationship concept person has with concept degree called has_degree[degree].institution, which shows the different institutions on the X axis. Next, we count all the entity_id’s that exist in person, and finally we bring in a relationship between person and organization called works_at[organization]_title, which presents the different job titles that exist, though in this case we add a filter where job title must equal Engineer.
Our results returns as follows:
Visualization #2 (Using transitive relationships)
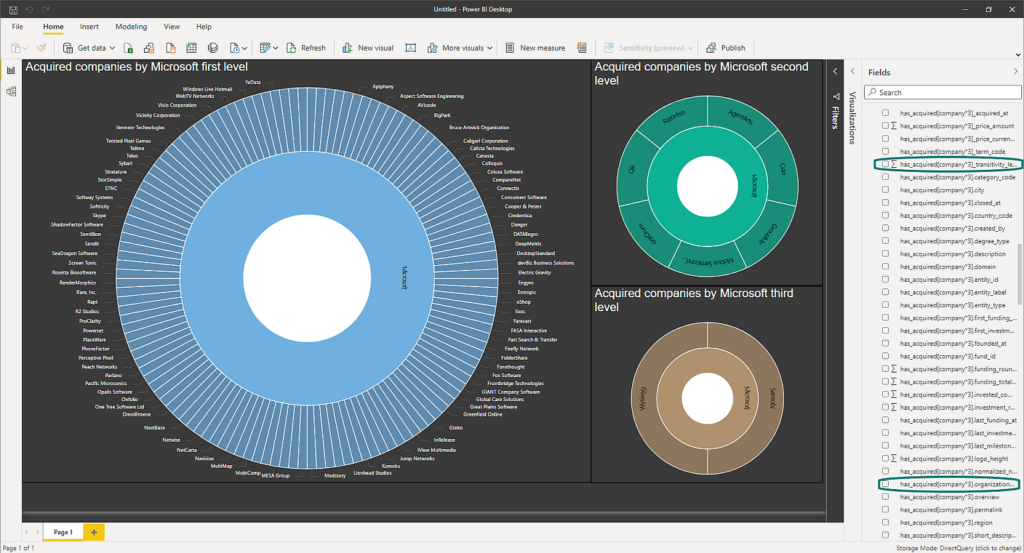
Among the many capabilities Timbr offers, such as inheritance, classifications, inference and graph algorithms, is also the option to create transitive relationships. So, for our second example we use transitive relationships to visualize the companies that were acquired by Microsoft as well as the companies who were acquired by Microsoft and went on to acquire companies themselves. We look at companies acquired up to 3 levels beneath Microsoft using the relationship called: has_acquired[company*3].organization_name, and state their transitivity level with the relationship called: has_acquired[company*3]_transitivity_level.
In this example using a Sunburst Chart we can see all the companies up to 3 levels beneath Microsoft, highlighted is a company called Sensobi which is 3 levels beneath Microsoft. It is important to mention that just as we created a relationship showing 3 levels of transitivity, we can easily and at any point create a relationship showing a different level of transitivity by simply changing the number 3 in parentheses to a different number we wish to drill down to.
Conclusion
The Timbr semantic graph platform turns Power BI into a user-friendly strategic tool that delivers unique insights and shortens time to value. Organizations can benefit from convenient and live access to data remotely. Data consumers can easily understand, explore and query the data by means of concepts, instead of dealing with a large number of tables and columns.
Click here to subscribe and set up in just a few minutes to start unleashing the power of your data today.
How do you make your data smart?
timbr virtually transforms existing databases into semantic SQL knowledge graphs with inference and graph capabilities, so data consumers can deliver fast answers and unique insights with minimum effort.

