A standardized semantic model for Google Analytics 4 reduces the complexity of data handling and transforms it into an intuitive strategic tool that democratizes data access, allowing marketing and sales teams to gain insights into user interactions across digital platforms with minimal technical barriers.
Introduction
Google Analytics 4 (GA4) is the latest evolution of the world’s leading web analytics service, designed to offer insights into web and app usage across millions of sites worldwide. This platform facilitates the analysis of user interactions, providing comprehensive insights into user behavior across websites, apps, and other digital assets.
The Challenge of Extracting Insights from GA4
Analyzing GA4 demands an understanding of its complex nested structure, including numerous nested tables and columns, and the ability to craft complex SQL queries, such as those incorporating UNNEST functions to obtain meaningful insights.
This level of expertise is typically beyond the reach of marketing and sales teams familiar with BI tools like Power BI, Data Studio, and Tableau, making the analytics process dependent on the specialized skills of data analysts or data engineers. Consequently, the time to generate valuable insights is extended, hindered by the availability and workload of these experts.
The GA4 SQL Knowledge Graph
The SQL knowledge graph introduces a virtual layer of connected, context-rich concepts with inference capabilities (“ontology“), linked to one or more data sources. These concepts, representing the business language, extend the database schema and table definitions, enabling users to query data by its meaning without needing to know the specific tables or columns where the data resides.
The Timbr SQL knowledge graph platform provides a standardized GA4 semantic data model, making data integration effortless and user interaction intuitive.
Features of the GA4 SQL Knowledge Graph:
- Semantic data model of business concepts, relationships, and properties.
- Simplified SQL queries without JOINs, UNIONs or UNNESTING, accessible from any BI tool.
- Data integration with external sources for a holistic view.
- Exploration and visualization of data as a relationship graph.
- Graph algorithms that provide unique insights into data patterns and behaviors.
Unleash the power of Your Data
How is it done?
Creating the GA4 SQL Knowledge Graph
Users can create their tailored GA4 SQL knowledge graph with Timbr in three straightforward steps:
1. Import the GA4 SQL Ontology into your Timbr environment
2. Automatically map the GA4 tables to the Ontology
3. Extend the GA4 SQL Ontology based on your business requirements.
The GA4 SQL Ontology Model
Based on the Big Query Schema, the GA4 SQL ontology represents the business concepts hidden in the nested structure of GA4 data.
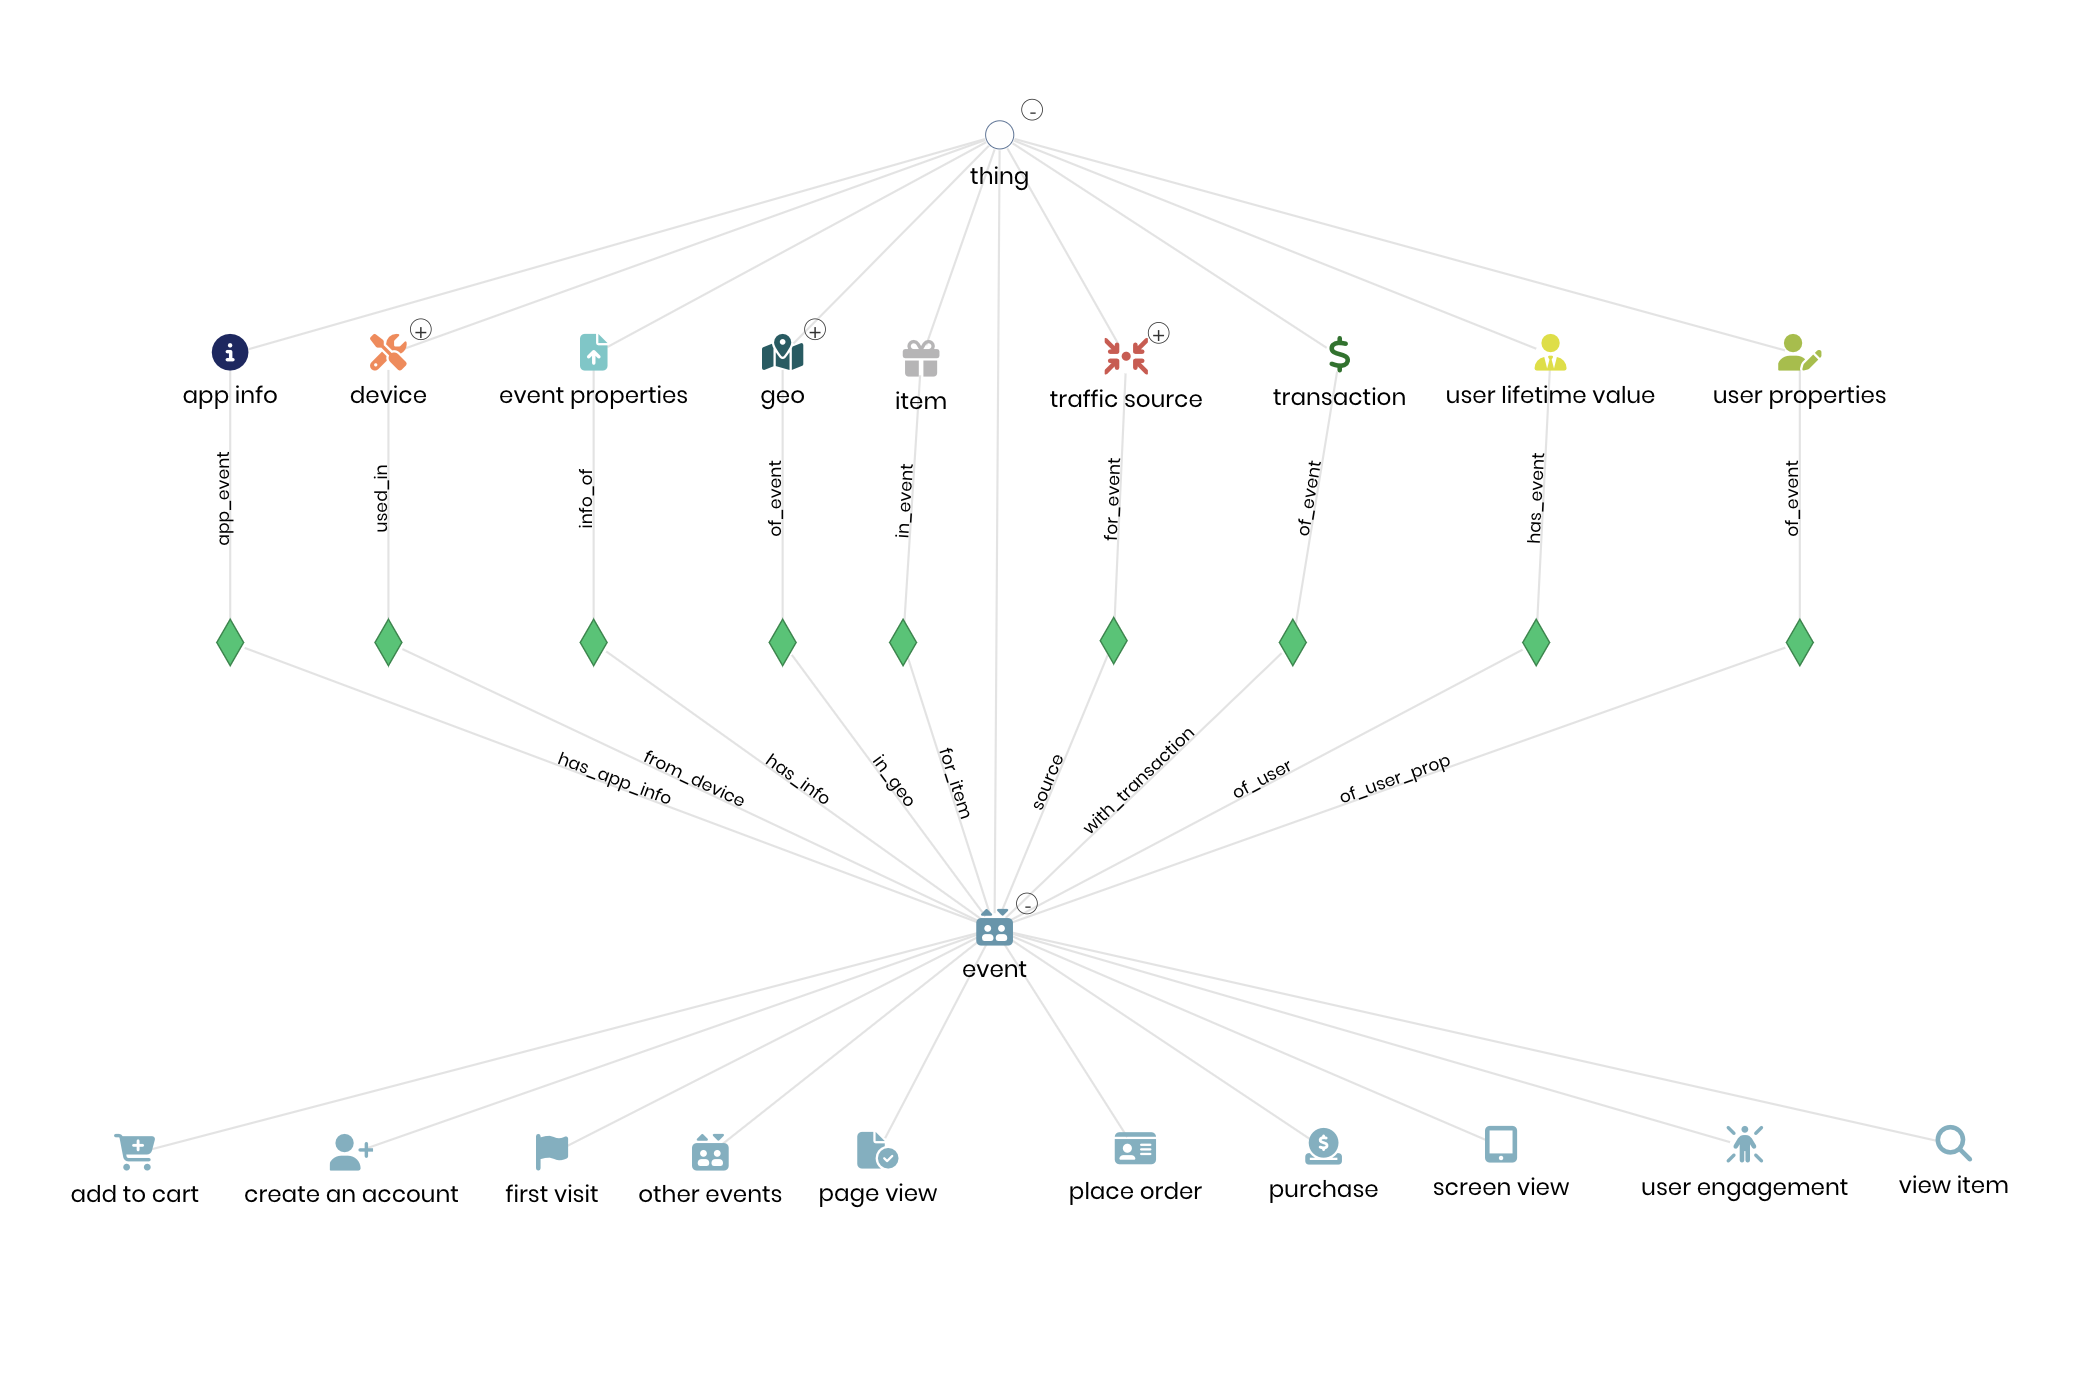
The Timbr platform provides a convenient ontology exploration tool that displays the concepts as a graph as seen in Figure 1. Users may click on a concept to read the concept’s definition, properties, relationships and underlying data.
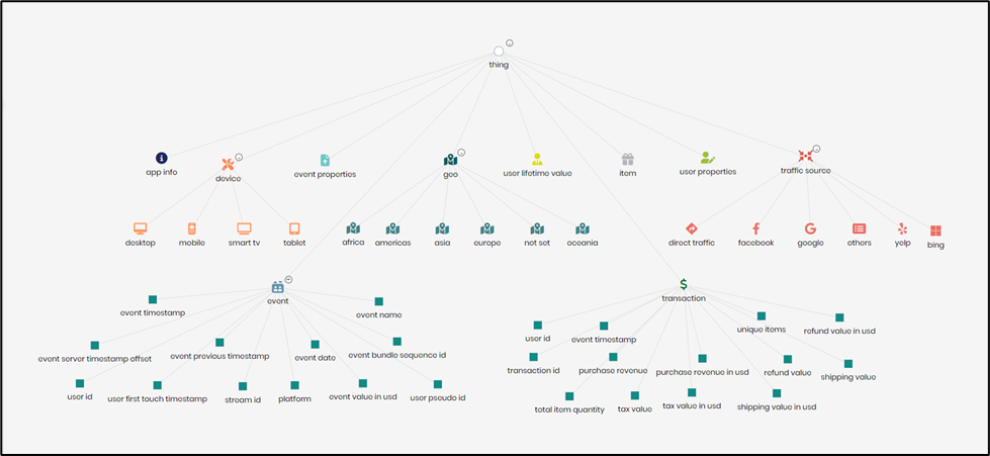
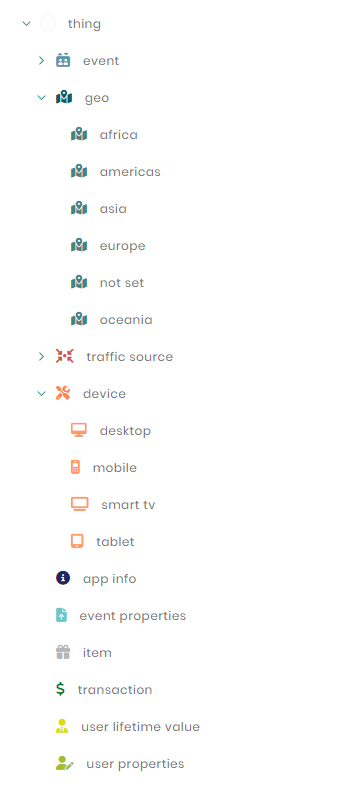
The ontology explorer also displays the ontology tree (Figure 2) that enables users to easily understand the hierarchy, structure and categorization of the concepts that represent the underlying data.
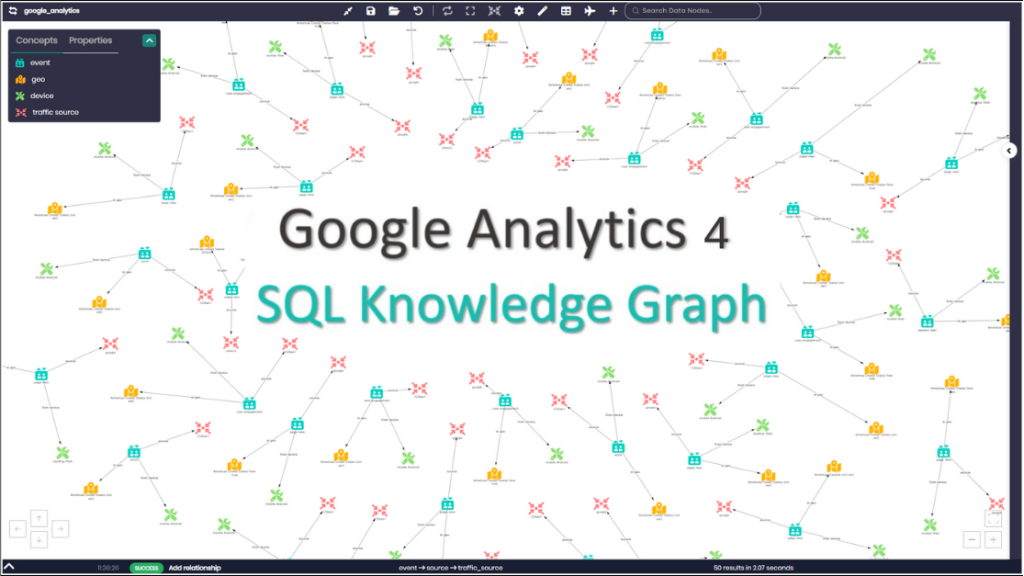
Users may also click on a concept to display relationships to other concepts (Figure 3).
In addition, users can easily extend the GA4 SQL Ontology as required, by manually modeling additional concepts and relationships that represent specific sources of data such as applications or other properties. As a result, users gain a 360° view of data that is accessible with simple SQL queries.
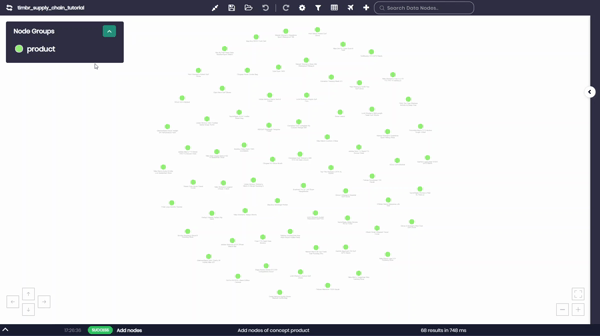
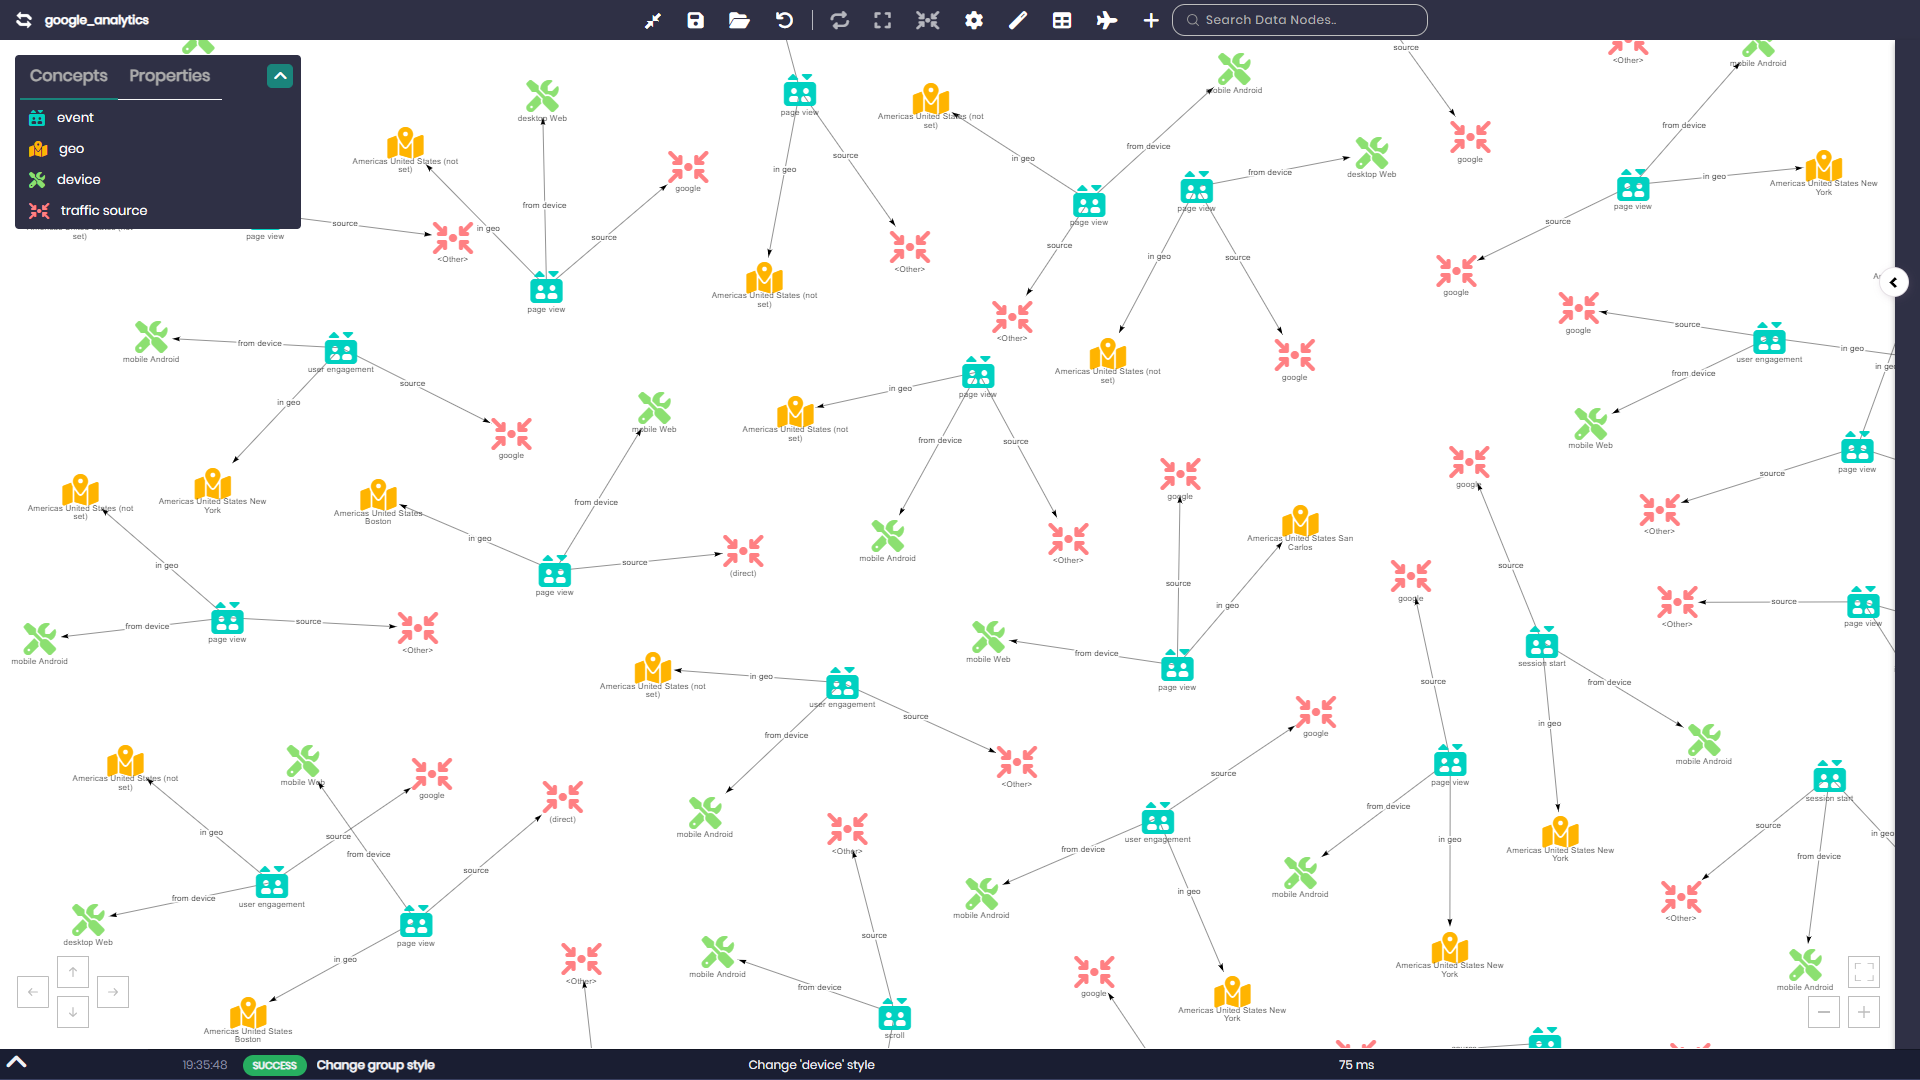
Data Exploration and Visualization as a Graph of Relationships
Timbr’s Graph Data Explorer enables users to visualize the underlying data as a graph, to explore and discover relationships and dependencies in the data. The module enables traversing the entire GA4 data so users can better understand the data, discover hidden value, visually find answers, and expose the data without the need to extract tables or views before running a query (Figure 4).
Simplified SQL Queries
One of the most powerful features of the SQL Knowledge Graph is that SQL queries of concepts (semantic SQL) are up to 90% shorter, simpler and more understandable than direct SQL queries of the underlying data. This is thanks to the ontology’s concepts inference capabilities and to the concepts’ encapsulation of relationships, so there’s no need to write SQL statements with Inner JOINS or UNNEST functions.
As a result, even moderately proficient SQL users can query the GA360 SQL knowledge graph. In addition, skilled users desiring to perform more complex analytics can also query the graph in R, Python, Scala, and Java.
To illustrate the power of semantic SQL, let’s look at some common business questions:
Example 1: What are the Number of Events by Country, Source, and Medium with Timbr’s Semantic SQL:
					SELECT
        COUNT(*) AS Event_Count,
       `in_geo[geo].country` AS Country,
       `source[traffic_source].source` AS Source,
       `source[traffic_source].medium` AS Medium
FROM `dtimbr`.`event`
GROUP BY Country, Source, Medium
ORDER BY Event_Count DESC
Example 2: What are the Conversion Rates by Traffic Source:
					SELECT
       `source[traffic_source].source` AS Traffic_Source,
       SUM(_type_of_purchase) AS Conversions,
       SUM(_type_of_page_view) AS Total_Events,
       ROUND((SUM(_type_of_purchase) / SUM(_type_of_page_view)) * 100, 2) AS Conversion_Rate
FROM `dtimbr`.`event`
GROUP BY Traffic_Source
ORDER BY Conversion_Rate DESC;
When Querying the Event concept, Timbr infers the type of events, enabling you to filter the different types by using the type_of column.
The type_of column returns 1 in the results if it is of the sub-type, and returns 0 if it is not.
Example 3: How does user engagement intensity vary by country and device category, and what are the counts of distinct event types, total events, and unique users per category, using Timbr’s Semantic SQL:
					SELECT
       `in_geo[geo].country` AS Country,
       `from_device[device].category` AS Device_Category,
       COUNT(DISTINCT `event_name`) AS Distinct_Event_Types,
       COUNT(*) AS Total_Events,
       COUNT(DISTINCT `has_info[event_properties].user_id`) AS Unique_Users
FROM `dtimbr`.`event`
GROUP BY Country, Device_Category
ORDER BY Unique_Users DESC, Distinct_Event_Types DESC, Total_Events DESC
In comparison, a snippet of the direct SQL query of BigQuery of example 3 would look like:
					WITH `event` AS (
    SELECT
        CONCAT(CAST(`event_timestamp` AS STRING), `user_id`) AS `entity_id`, 'event' AS `entity_type`, `event_name` AS `entity_label`, `event_server_timestamp_offset`, `event_bundle_sequence_id`, `stream_id`, `user_id`, `event_date`, `event_value_in_usd`, `event_previous_timestamp`, `event_name`, `event_timestamp`, `platform`, `user_first_touch_timestamp`
    FROM (SELECT `event_bundle_sequence_id` AS `event_bundle_sequence_id`, `event_date` AS `event_date`, `event_name` AS `event_name`, `event_previous_timestamp` AS `event_previous_timestamp`, `event_server_timestamp_offset` AS `event_server_timestamp_offset`, `event_timestamp` AS `event_timestamp`, `event_value_in_usd` AS `event_value_in_usd`, `platform` AS `platform`, CAST(`stream_id` AS STRING) AS `stream_id`, `user_first_touch_timestamp` AS `user_first_touch_timestamp`, `user_pseudo_id` AS `user_id`
          FROM `my-project-1512833185723`.`google_analytics_sample`.`events_20210131`) AS `map_2`),
     `device` AS (
    SELECT
        CONCAT(`user_id`, CAST(`event_timestamp` AS STRING)) AS `entity_id`, 'device' AS `entity_type`, CONCAT(`category`, CONCAT(' ', `operating_system`)) AS `entity_label`, `is_limited_ad_tracking`, `mobile_model_name`, `advertising_id`, `language`, `event_timestamp`, `mobile_brand_name`, CAST(NULL AS STRING) AS `hostname`, `mobile_os_hardware_model`, `operating_system_version`, `user_id`, CAST(NULL AS STRING) AS `browser`, `vendor_id`, `operating_system`, `mobile_marketing_name`, CAST(NULL AS STRING) AS `browser_version`, `category`, `time_zone_offset_seconds`
    FROM (SELECT CAST(`advertising_id` AS STRING) AS `advertising_id`, `category` AS `category`, `event_timestamp` AS `event_timestamp`, `is_limited_ad_tracking` AS `is_limited_ad_tracking`, `language` AS `language`, `mobile_brand_name` AS `mobile_brand_name`, `mobile_marketing_name` AS `mobile_marketing_name`, `mobile_model_name` AS `mobile_model_name`, CAST(`mobile_os_hardware_model` AS STRING) AS `mobile_os_hardware_model`, `operating_system` AS `operating_system`, `operating_system_version` AS `operating_system_version`, `time_zone_offset_seconds` AS `time_zone_offset_seconds`, `user_id`, CAST(`vendor_id` AS STRING) AS `vendor_id`
          FROM (SELECT `user_pseudo_id` AS `user_id`, `event_timestamp`, `device`.*
                FROM `my-project-1512833185723`.`google_analytics_sample`.`events_20210131`) AS `m1`) AS `map_3`),
     `event_properties` AS (
    SELECT
        CONCAT(CONCAT(`property_name`, CAST(`event_timestamp` AS STRING)), `user_id`) AS `entity_id`, 'event_properties' AS `entity_type`, CONCAT(`property_name`, CONCAT(' ', `property_value`)) AS `entity_label`, `user_id`, `property_value`, `event_timestamp`, `property_name`
    FROM (SELECT DISTINCT `user_pseudo_id` AS `user_id`, `event_timestamp`, `event_props`.`key` AS `property_name`, `event_props`.`value`.`string_value` AS `property_value`
          FROM `my-project-1512833185723`.`google_analytics_sample`.`events_20210131`, UNNEST(`event_params`) AS `event_props`
          WHERE `event_props`.`value`.`string_value` IS NOT NULL AND `user_pseudo_id` IS NOT NULL AND `event_props`.`key` <> 'user_id') AS `map_4`),
     `geo` AS (
    SELECT
        CONCAT(CAST(`event_timestamp` AS STRING), `user_id`) AS `entity_id`, 'geo' AS `entity_type`, CONCAT(CONCAT(`continent`, CONCAT(' ', `country`)), CONCAT(' ', `city`)) AS `entity_label`, `continent`, `country`, `city`, `user_id`, `metro`, `sub_continent`, `event_timestamp`, `region`
    FROM (SELECT `user_pseudo_id` AS `user_id`, `event_timestamp`, `geo`.*
          FROM `my-project-1512833185723`.`google_analytics_sample`.`events_20210131`) AS `map_5`),
     `dtimbr_event_1` AS (
    SELECT
        `event`.`entity_id`, `event`.`entity_type`, `event`.`entity_label`, `event`.`event_server_timestamp_offset`, `event`.`event_bundle_sequence_id`, `event`.`stream_id`, `event`.`user_id`, `event`.`event_date`, `event`.`event_value_in_usd`, `event`.`event_previous_timestamp`, `event`.`event_name`, `event`.`event_timestamp`, `event`.`platform`, `event`.`user_first_touch_timestamp`, `in_geo[geo]`.`country` AS `in_geo[geo].country`, `has_info[event_properties]`.`user_id` AS `has_info[event_properties].user_id`, `from_device[device]`.`category` AS `from_device[device].category`
    FROM `event` AS `event`
    LEFT JOIN `device` AS `from_device[device]` ON `event`.`user_id` = `from_device[device]`.`user_id` AND `event`.`event_timestamp` = `from_device[device]`.`event_timestamp`
    LEFT JOIN `event_properties` AS `has_info[event_properties]` ON `event`.`user_id` = `has_info[event_properties]`.`user_id` AND `event`.`event_timestamp` = `has_info[event_properties]`.`event_timestamp`
    LEFT JOIN `geo` AS `in_geo[geo]` ON `event`.`user_id` = `in_geo[geo]`.`user_id` AND `event`.`event_timestamp` = `in_geo[geo]`.`event_timestamp`
)
SELECT
    `in_geo[geo].country` AS `Country`, `from_device[device].category` AS `Device_Category`,
    COUNT(DISTINCT `event_name`) AS `Distinct_Event_Types`, COUNT(*) AS `Total_Events`,
    COUNT(DISTINCT `has_info[event_properties].user_id`) AS `Unique_Users`
FROM `dtimbr_event_1`
GROUP BY `Country`, `Device_Category`
ORDER BY `Unique_Users` DESC, `Distinct_Event_Types` DESC, `Total_Events` DESC
Data Virtualization with External Data
The Timbr platform enables users to enrich and extend their knowledge base by federating their GA4 BigQuery data with any external data, whether the data is in BigQuery or any other database such as Postgres, SQL Server, Athena, Databricks, etc.
Data Virtualization allows you to introduce new concepts and relationships to the GA4 SQL Ontology from additional data sources, therefore simplifying data integration.
In Summary
The Timbr platform’s semantic capabilities transform GA4 into an accessible strategic tool, expediting the journey to valuable insights. Data consumers gain the ability to explore and query data through intuitive concepts, bypassing the complexity of direct interaction with vast datasets.
Business users can employ simple queries or use their favorite BI tool, while data scientists benefit from a clean and high-quality data model, reducing the time spent on data preparation and analysis.
Contact us to experience the GA4 SQL Knowledge Graph on your own GA4 data. Set up in just a few minutes so you can start unleashing the power of your data today.
Are you using your data strategically?
Timbr virtually transforms existing databases into semantic SQL knowledge graphs with inference and graph capabilities, so data consumers can deliver fast answers and unique insights with less effort.
With Timbr, your organization can join the knowledge revolution.