DAX vs SQL Benchmark
The DAX vs SQL benchmark evaluates the complexity of defining metrics in DAX compared to Timbr’s SQL measures.
DAX has long been the default modeling language for Power BI, but it requires specialized expertise and translates into SQL at runtime, creating performance overhead and debugging challenges.
By contrast, SQL measures are coded once in Timbr’s ontologies, executed directly in the database, and reused across tools. This makes them easier to maintain, portable, and more efficient while still fully compatible with Power BI.
benchmark settings
Timbr’s semantic model allows Power BI metrics to be expressed directly in SQL instead of DAX. For this benchmark, we migrated representative DAX measures from the AdventureWorks semantic model in Power BI into SQL measures in Timbr. Complexity was evaluated using three dimensions: the number of lines required to define each measure, the presence of join dependencies, and the overall maintainability of the definitions.
What it shows
This side-by-side comparison highlights how SQL-based measures reduce complexity by up to 70%, simplify governance, and preserve full compatibility with existing Power BI dashboards.
DAX Measure Example (Before)
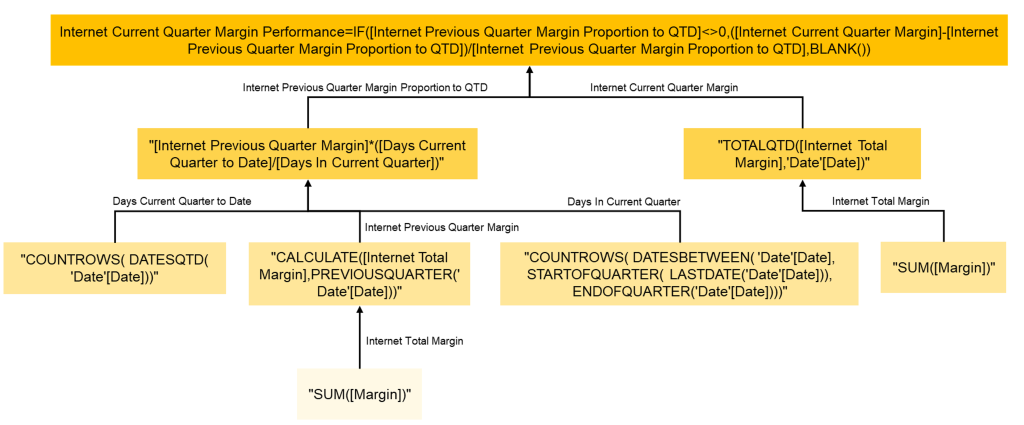
Defining the same metric in Power BI requires multiple nested DAX functions and dependencies.
Equivalent SQL Measure in Timbr (After)
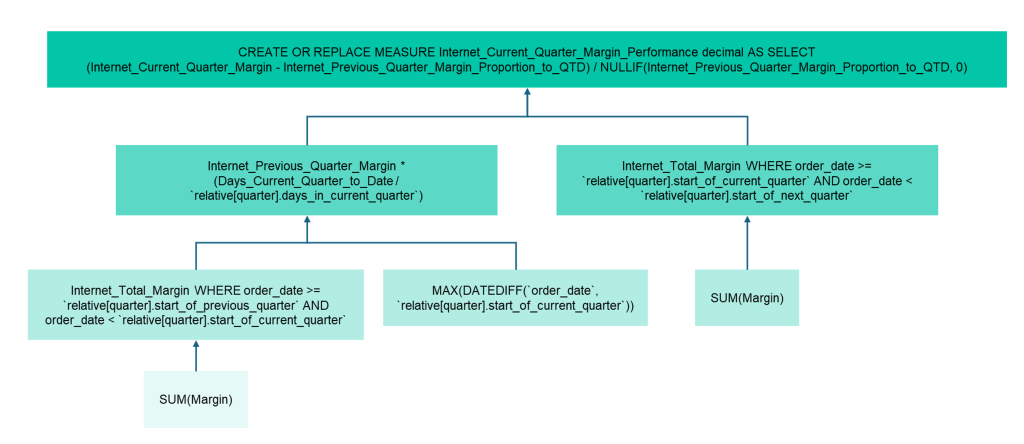
In Timbr’s semantic model, the same metric is expressed in SQL with fewer lines, simpler syntax, and direct execution in the database.
Query Complexity Comparison
| Metric Example | DAX in Power BI | SQL in Timbr |
|---|---|---|
| Internet Current Quarter Margin | 42 lines, nested dependencies | 13 lines, no joins |
| Internet Previous Quarter Margin | 36 lines, nested dependencies | 11 lines, no joins |
| Customer Lifetime Value | 57 lines, multiple joins | 15 lines, 1 join |
| Rolling 90-day Churn | 41 lines, multiple joins | 12 lines, 1 join |
Across representative metrics, SQL measures in Timbr reduced query definitions by up to 70%, eliminating unnecessary joins and simplifying dependencies while preserving full compatibility with Power BI dashboards.