Forefront of technology to fight COVID-19
The Israeli national project
HOW BIG DATA CAN MAKE THE DIFFERENCE
To assist the Israeli Ministry of Health, we at timbr.ai used our propriety technology, in a joint effort with the Corona National Information and Knowledge Center, to create a dedicated COVID-19 SQL Knowledge Graph. The data is gathered from hundreds of sources worldwide, consisting of virus-related information and external influencers, that is continuously feeding the Knowledge Graph.
Implemented in just a few days, the knowledge graph has been in use since March by researchers and scientists, helping them to explore and analyze information simply and quickly.
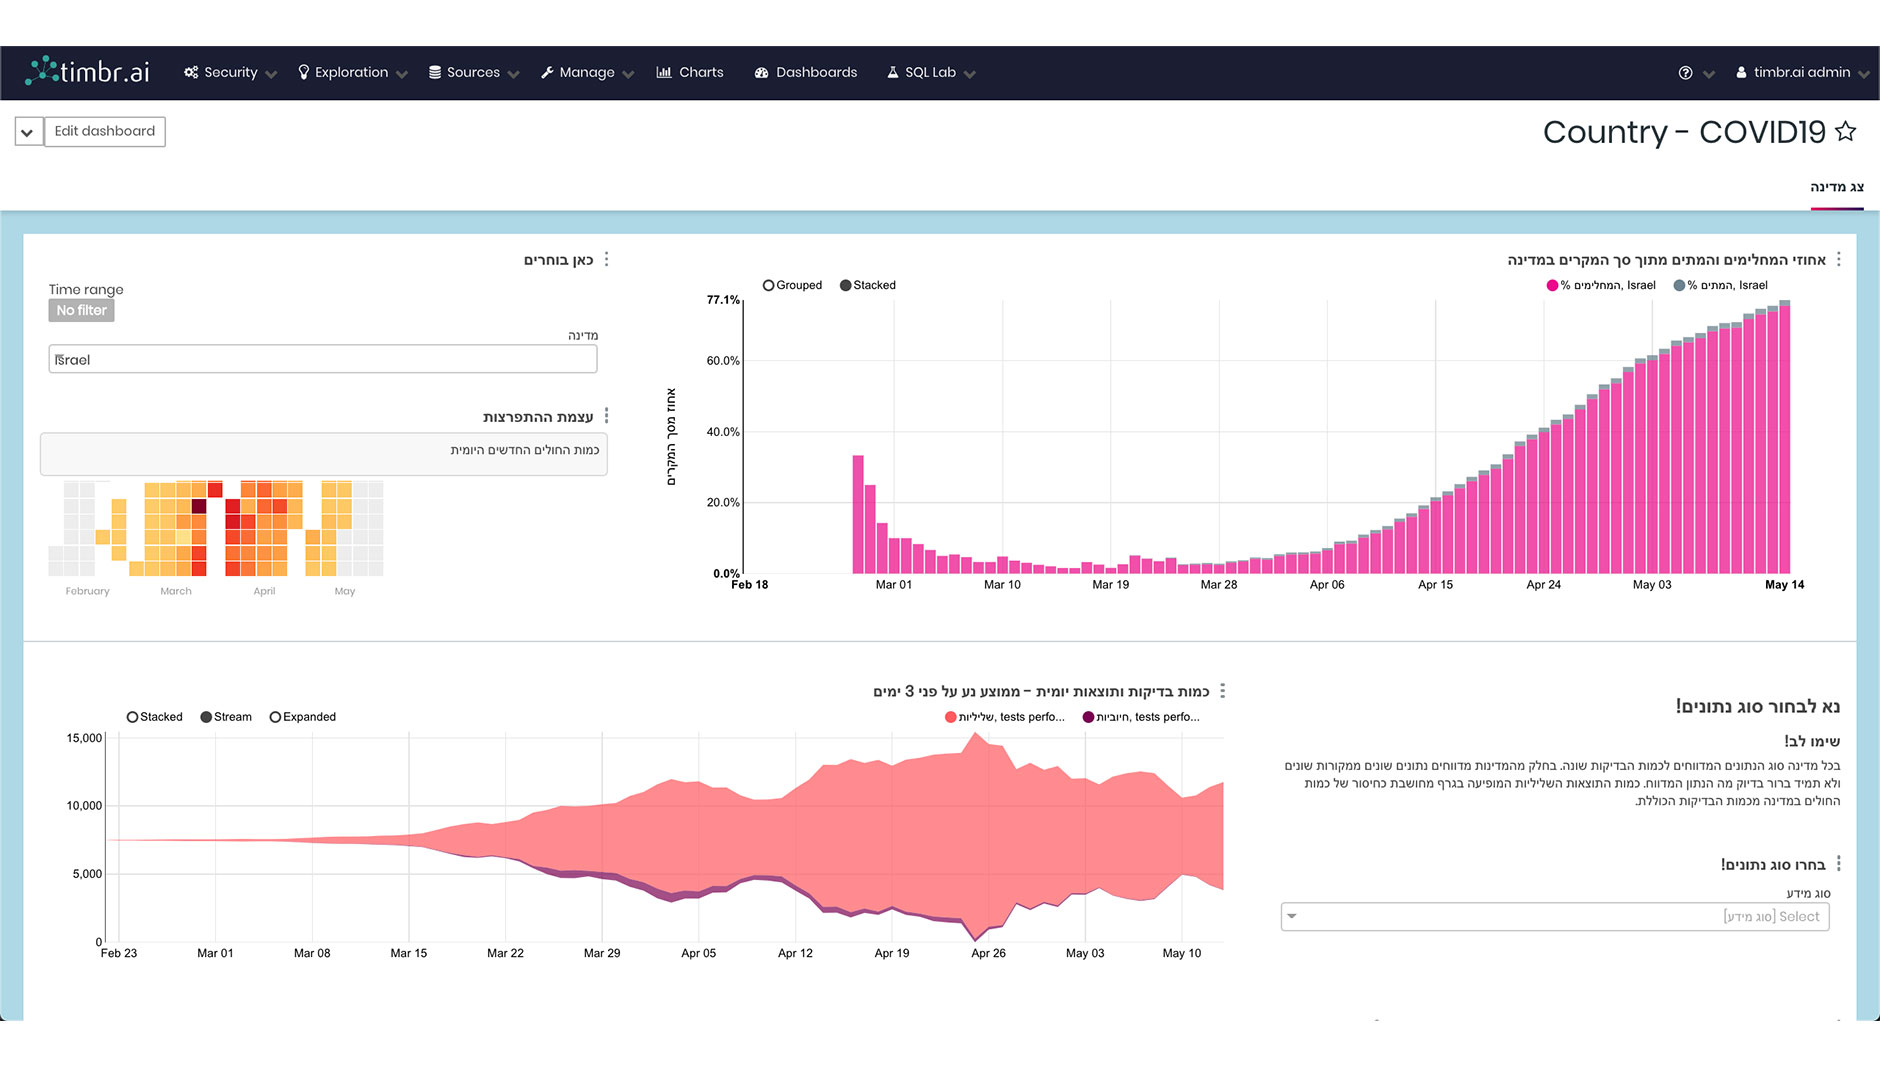
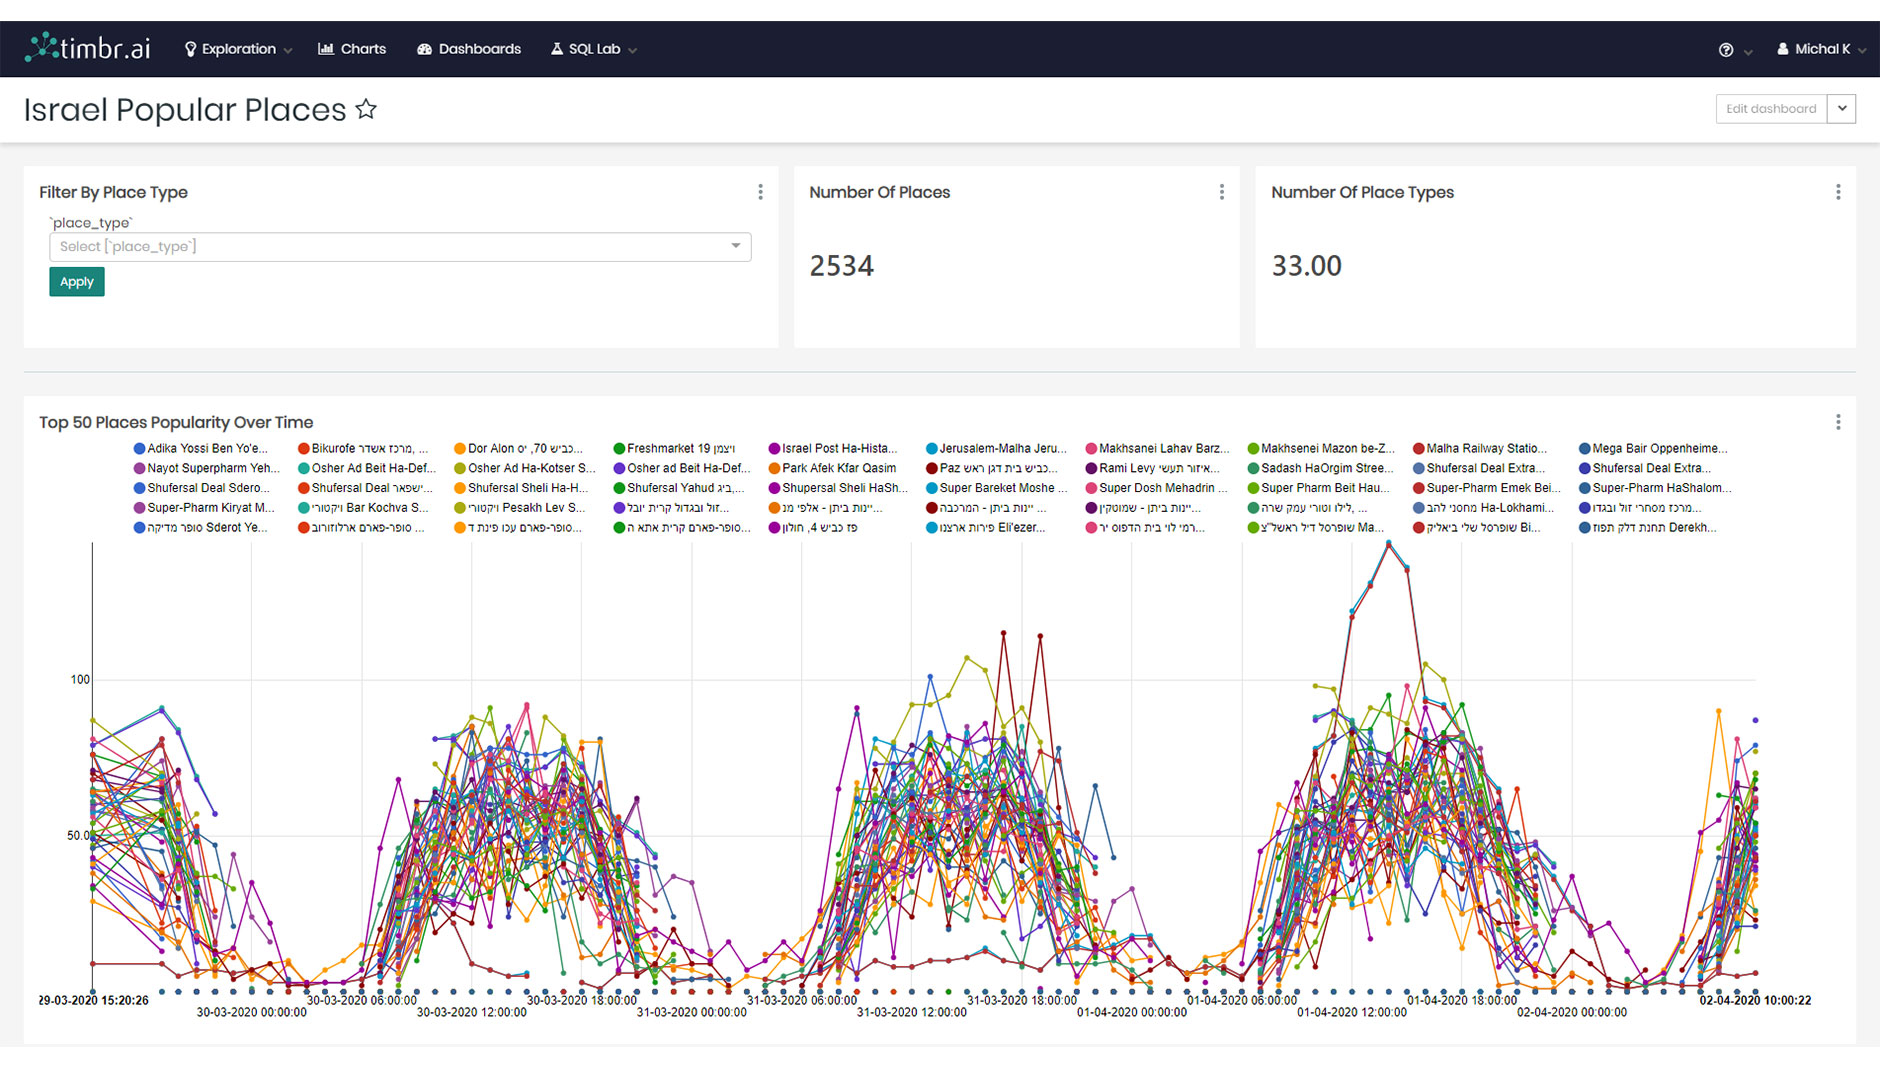
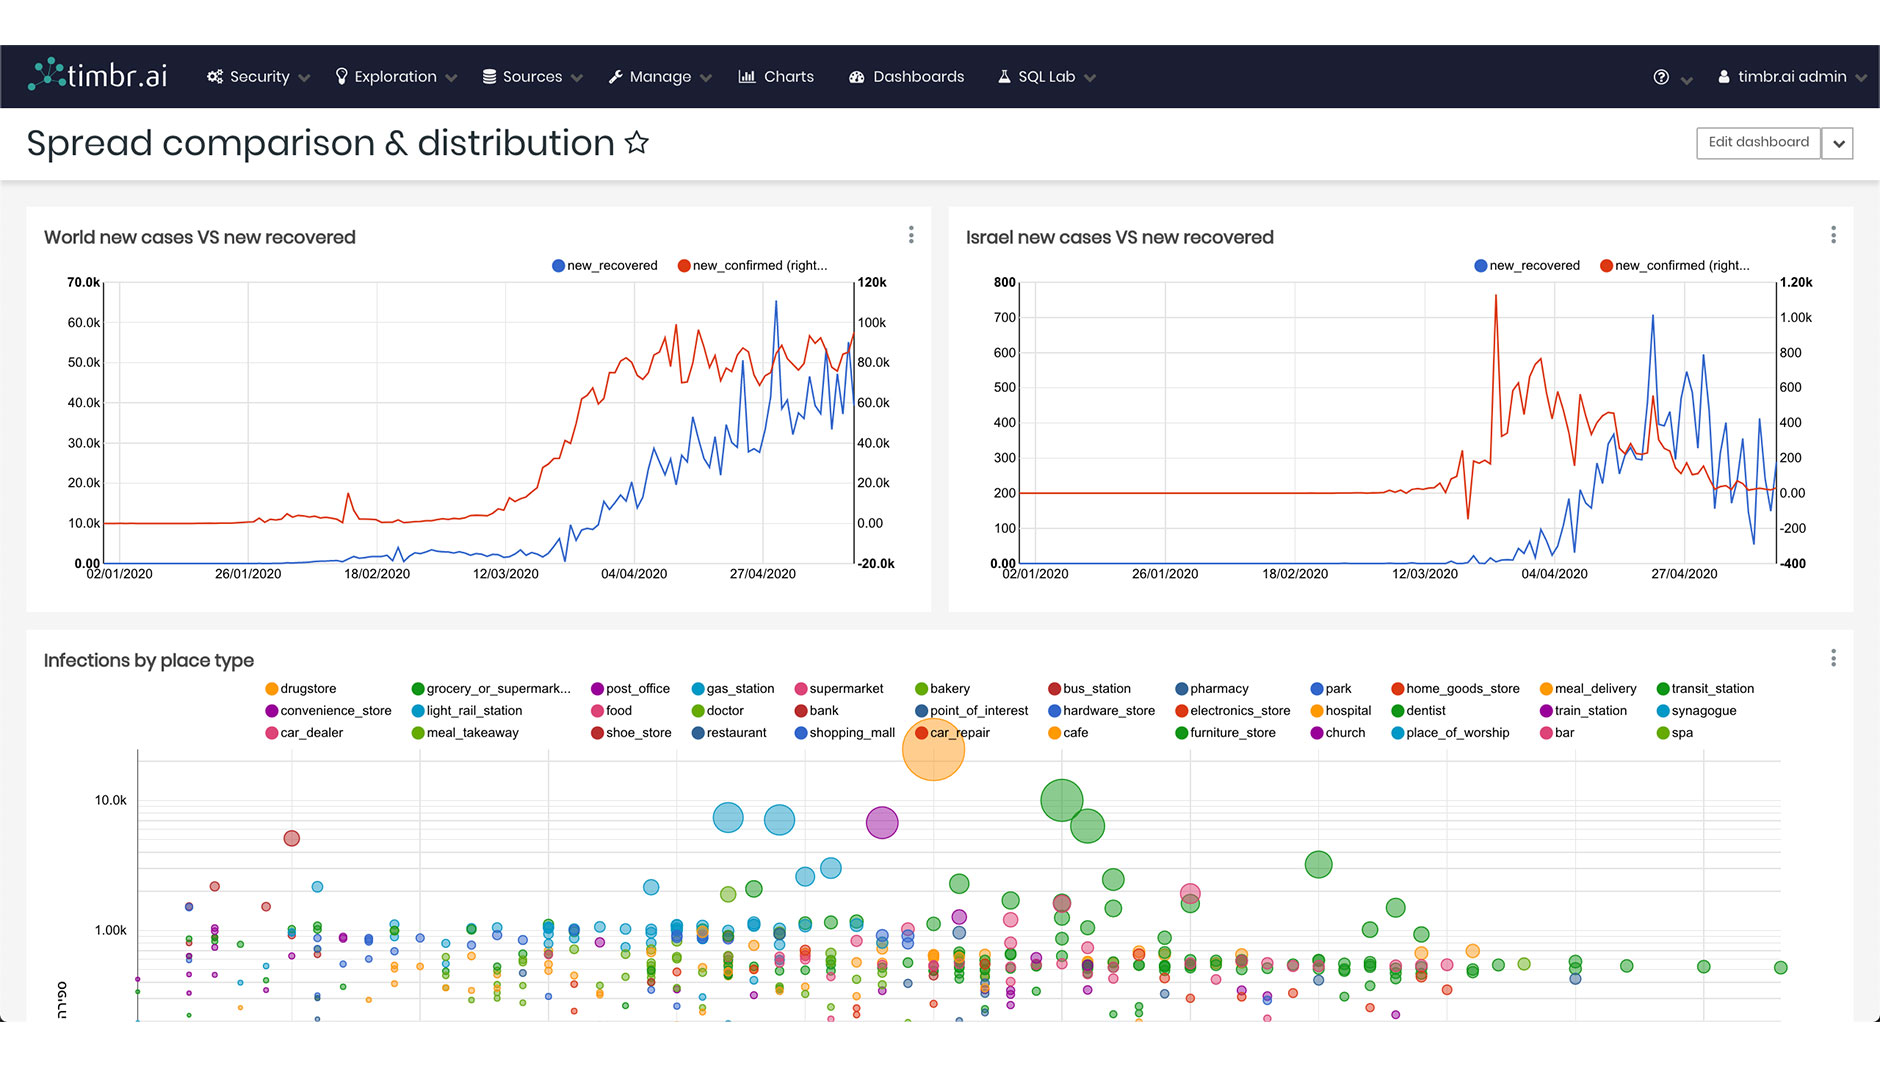
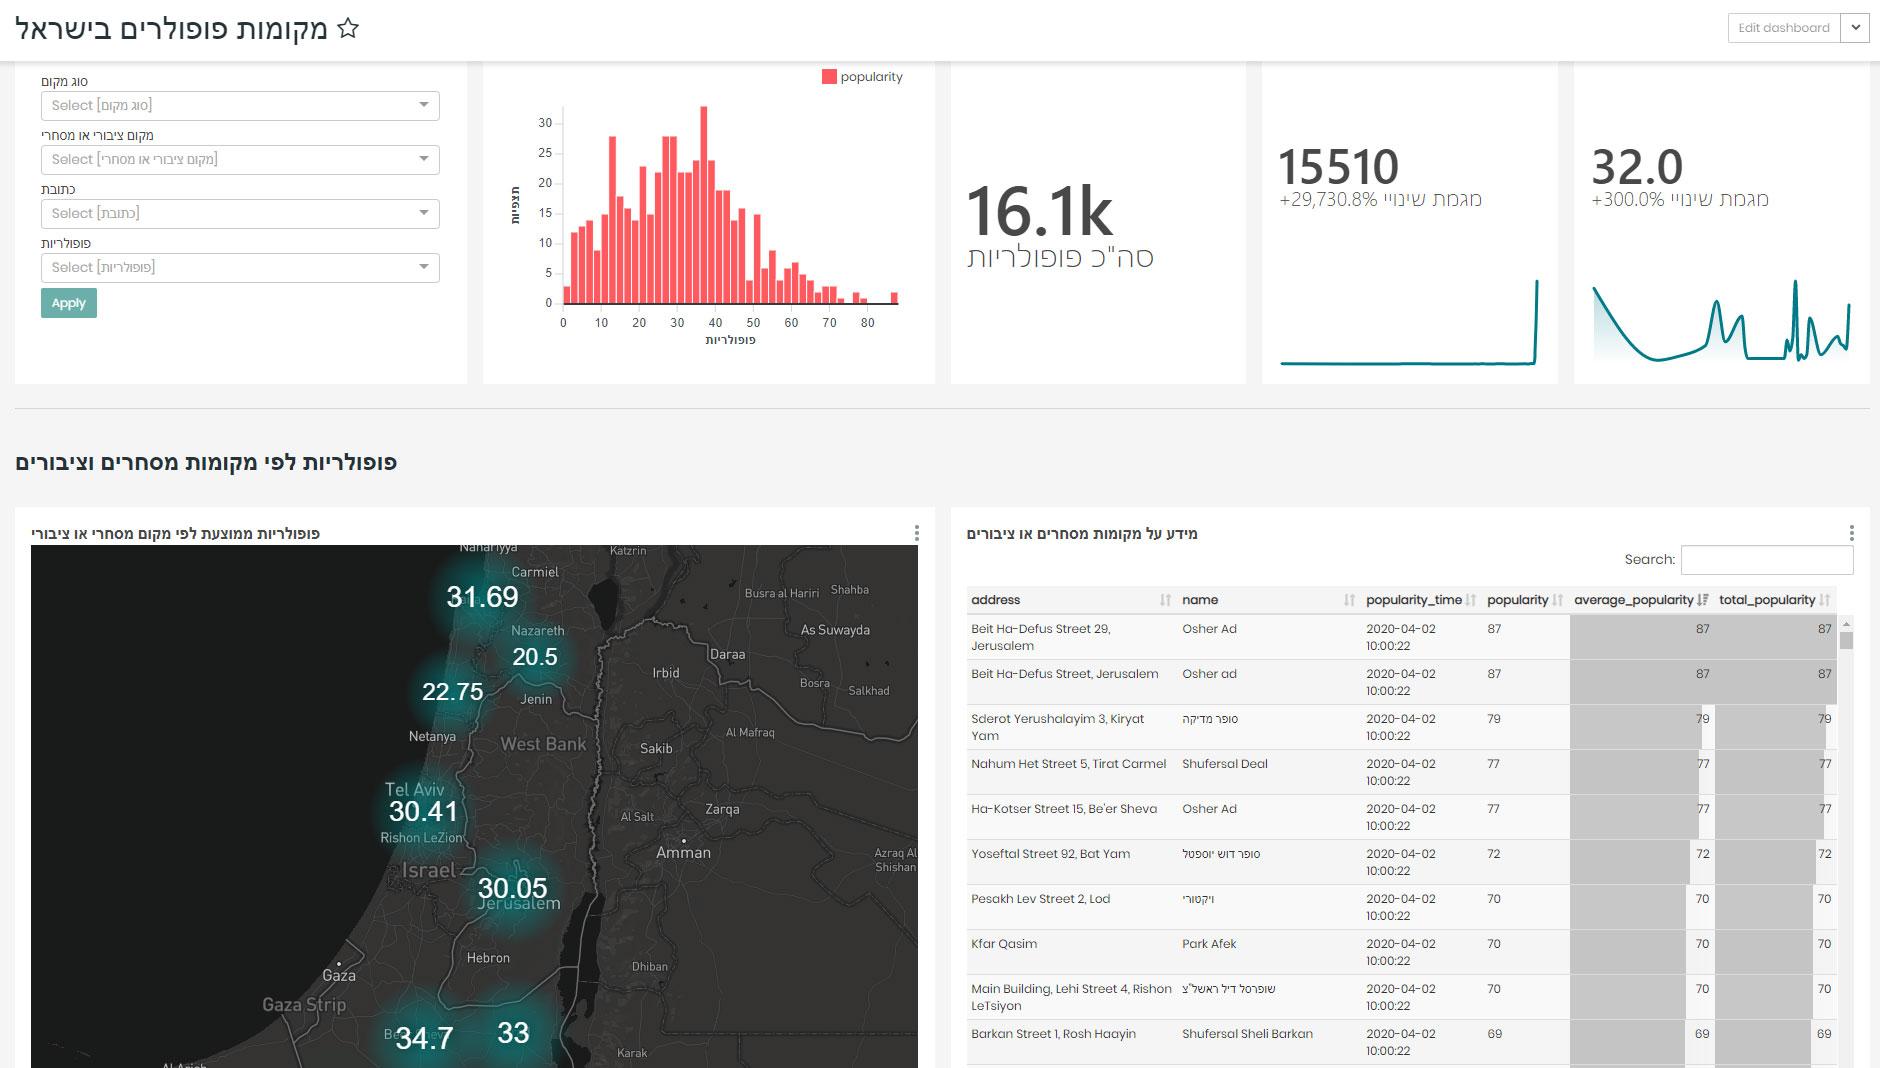
The platform enables government authorities and researchers to answer complex questions, find relationships, and visualize viable information to choose the right strategies in dealing with the pandemic.
Choosing the right treatment protocol
Understanding the virus spread rate
Deciding on effective quarantine Limitations
From creation to consumption
The knowledge graph integrates hundreds of data points from multiple sources into a
single connected graph to allow short SQL queries by all data consumers
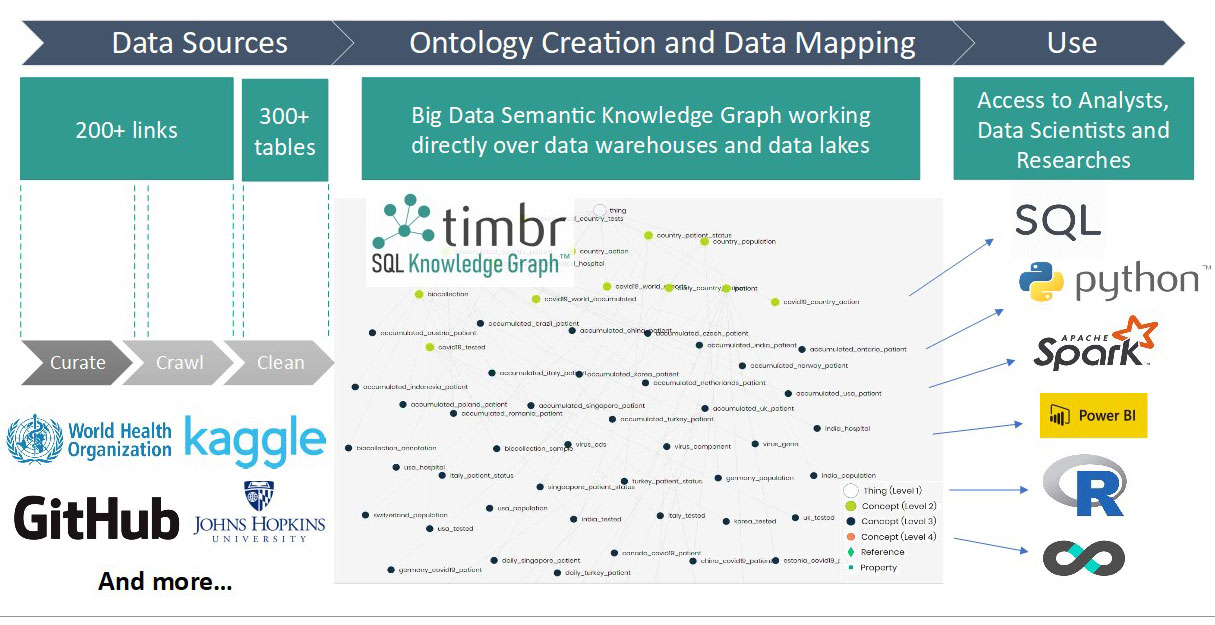


Complex BIG-DATA Analytics made easy with the Covid-19 SQL Knowledge Graph
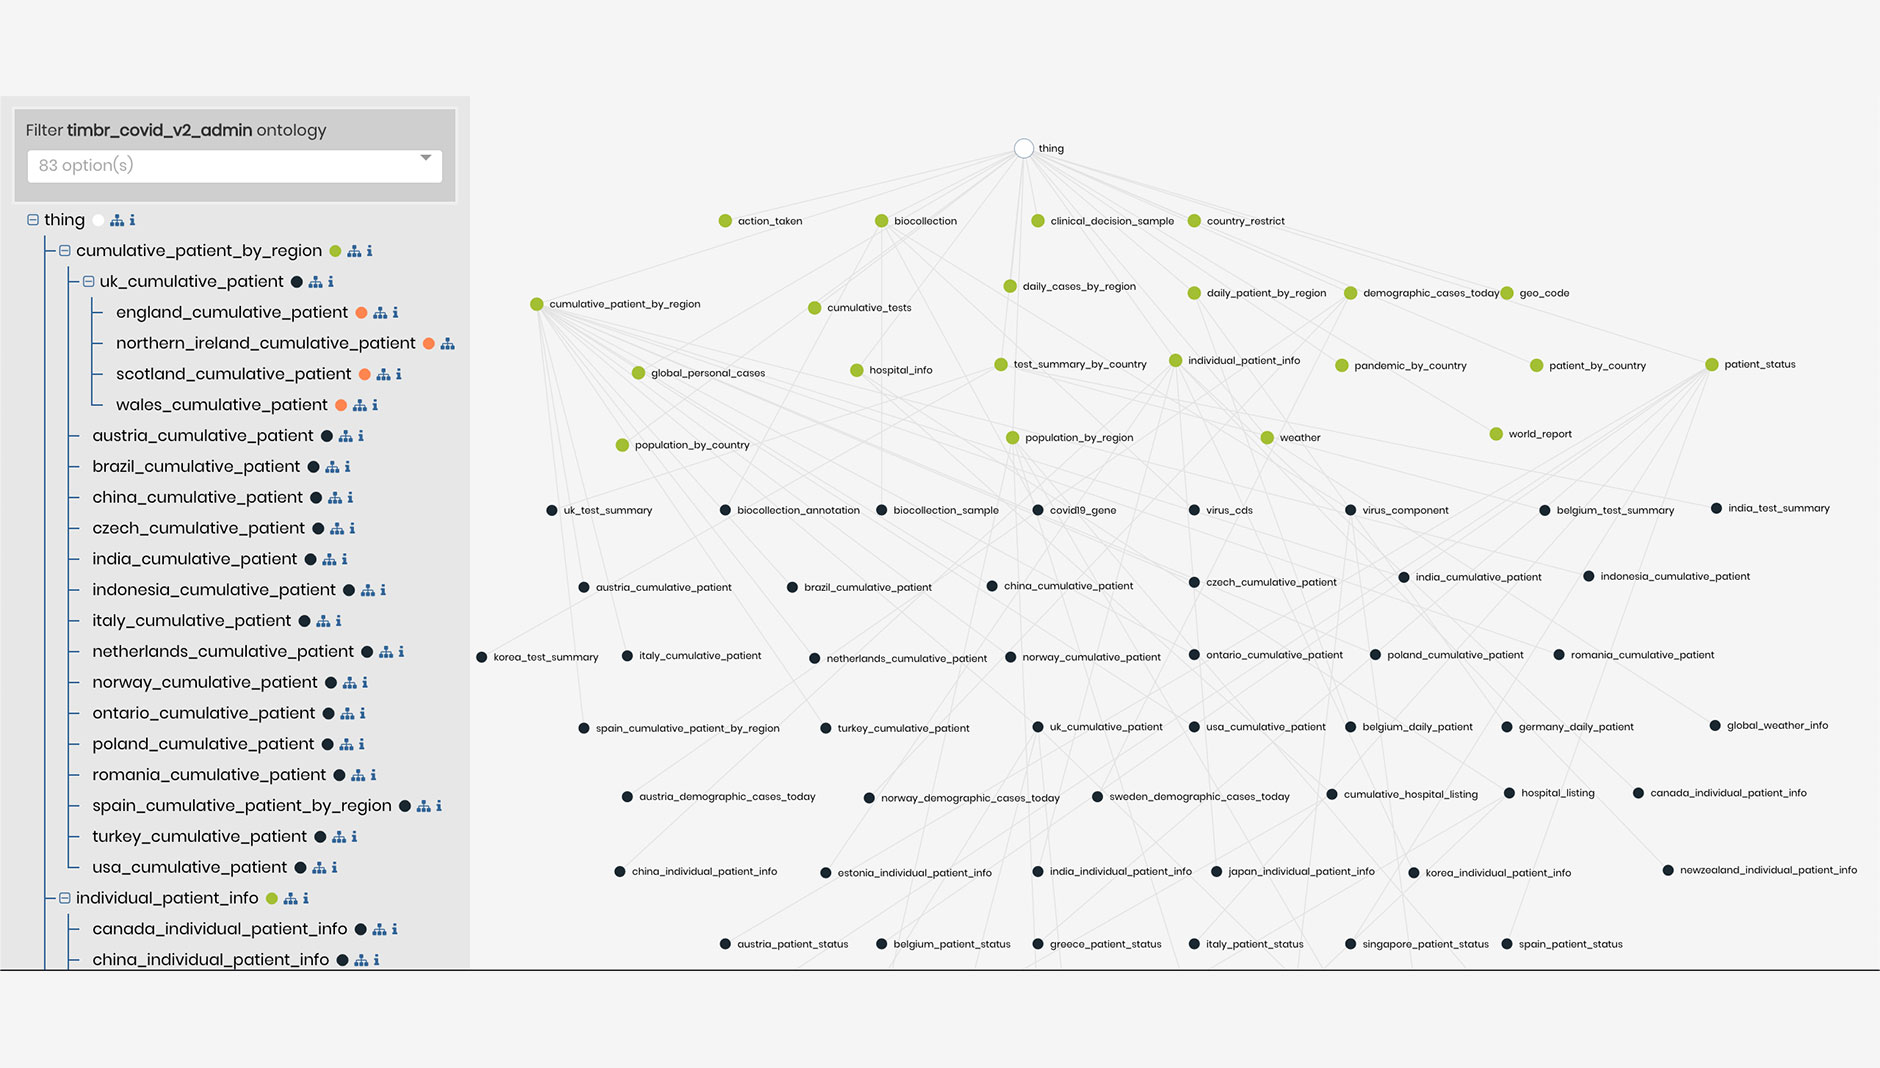
A smart tool to query and visualize the database as a graph of connected data, discover relationships and create dashboards to gain viable insights in real-time
The knowledge graph sophisticated capabilities allow to embed business logic into the data, discover relationships, create hierarchies, and perform graph exploration and visualization. The information from multiple datasets is virtually integrated into abstract concepts that provide common meaning to the data. Users query the concepts in standard SQL, Spark, Phyton and R, or using BI tools, and benefit from a 360° perspective of the concepts.
For example, the concept “patients” includes statistics and relevant information about people who were diagnosed with COVID19. The concept represents a variety of different tables from different datasets with different column names, each one according to its origin, yet all of them accessible through the same concept with standardized properties (columns). This allows you to query the concept “patients” as if all the datasets where one virtual table, with context-enriched relationships to other concepts, turning complex queries to easy and intuitive abstract questions and enabling easy segmentation by region, country, state, date of hospitalization, date of recovery, hospital capacity, tests per country, population, etc. The results are saved and can be used for further analysis or creation of predictive models.