In a previous post we discussed how an off-the-shelf, customizable SQL knowledge graph turns Google Analytics 360 into a user-friendly strategic tool that shortens analysts time-to-value and empowers them with access to granular-level insights of visitors’ behavior across properties.
We now present how the Timbr semantic graph data management platform empowers Looker Studio to deliver advanced analytics.
Introduction
Google Looker Studio, formerly known as Data Studio, enables users to transform data into customizable informative reports and dashboards. Apart from the Google-based data sources, it also supports many on-premises and cloud-based data sources. Connectors are tailored to specific cloud services or databases.
Looker Studio is constrained in its data modeling features when it comes to interconnecting tables from different data sources, as it currently supports only left outer joins. This limits the ability to express many-to-many relationships and often requires complicated workarounds that are time-consuming and hard to manage.
Another significant challenge faced by Looker Studio users is dealing with big data. Making sense of large, interrelated, and varied amounts of data simultaneously connected to Looker Studio is a very complex task, such is the case when needing to compare one metric or dimension to another to test conditions in formulas.
Lastly, after dealing with the previous challenges, Looker Studio does not offer graph analytics capabilities that provide unique insights about the data.
Timbr semantic graph data management platform
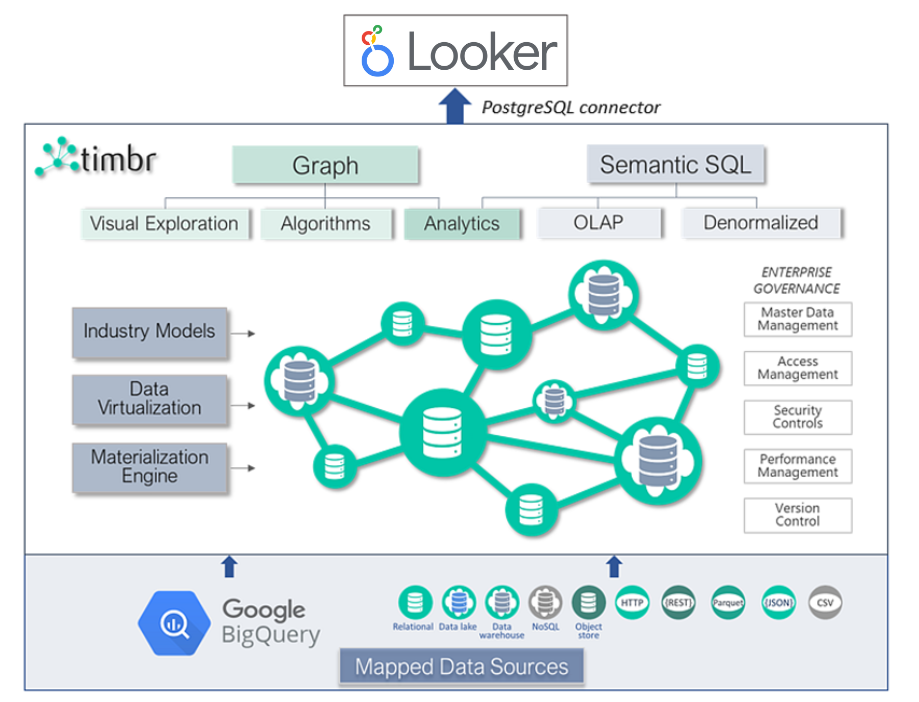
Timbr is integrated into a collaborative, AI-enabled platform that connects to all popular BI tools and to most common databases and sources of data, to provide data consumers with fast, convenient semantic graph capabilities needed to better understand the data, discover hidden value, and expose the data without extracting tables or views before running a query.
Timbr’s semantic layer conveniently maps to a wide range of data sources with standard connectors. Users can visually explore and traverse the data as a single connected graph, and they can query it using semantic SQL code that is significantly less complex than direct SQL queries of the underlying databases.
Timbr also supports graph algorithms directly over relational databases and provides a comprehensive library to perform graph analytics and automate analytical workflows.
Enhancing Looker Studio with Timbr’s semantic graph capabilities
Timbr removes the heavy lifting of the data modeling step from Looker Studio by enabling the creation of a conceptual model that gives meaning and represents the data. Some of the many advantages are:
- Users’ response time is shortened since time is spent on producing the reports rather than on exploring and preparing the data.
- Changes to the data model automatically reflect on the report. For example, adding/removing data from new sources is managed in Timbr’s data modeler, without need to alter or edit the report to reflect this change.
- The model (knowledge graph) can be used in any other application outside of Looker Studio.
Another benefit to Looker Studio users is the creation of reports or dashboards that require complex SQL queries. Timbr greatly simplifies these queries by taking advantage of the semantic layer that represents the data. Users query the semantic concepts that represent the data and embed relationships and logic, so there’s no need for Join and Union statements.
Connecting Looker Studio to Timbr – Example
For this example, we will use the same BigQuery dataset presented in our previous post.
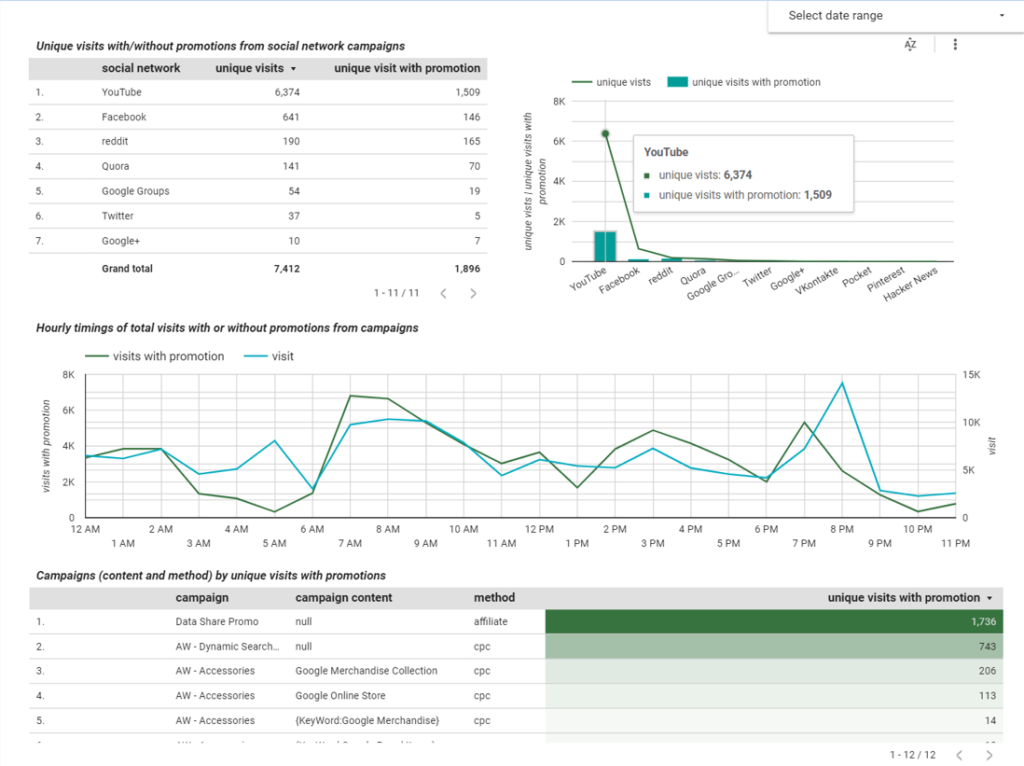
Our assignment from the marketing team is to produce a live report in Google Looker Studio with information to monitor and optimize current marketing campaigns. The report should include:
- Unique visits with or without promotions originating from social network campaigns
- Hourly timings of total visits with or without promotions from campaigns
- Campaigns (content and method) by unique visits with promotions
The knowledge graph that we will be using is timbr_ga_sessions, which currently looks like this:
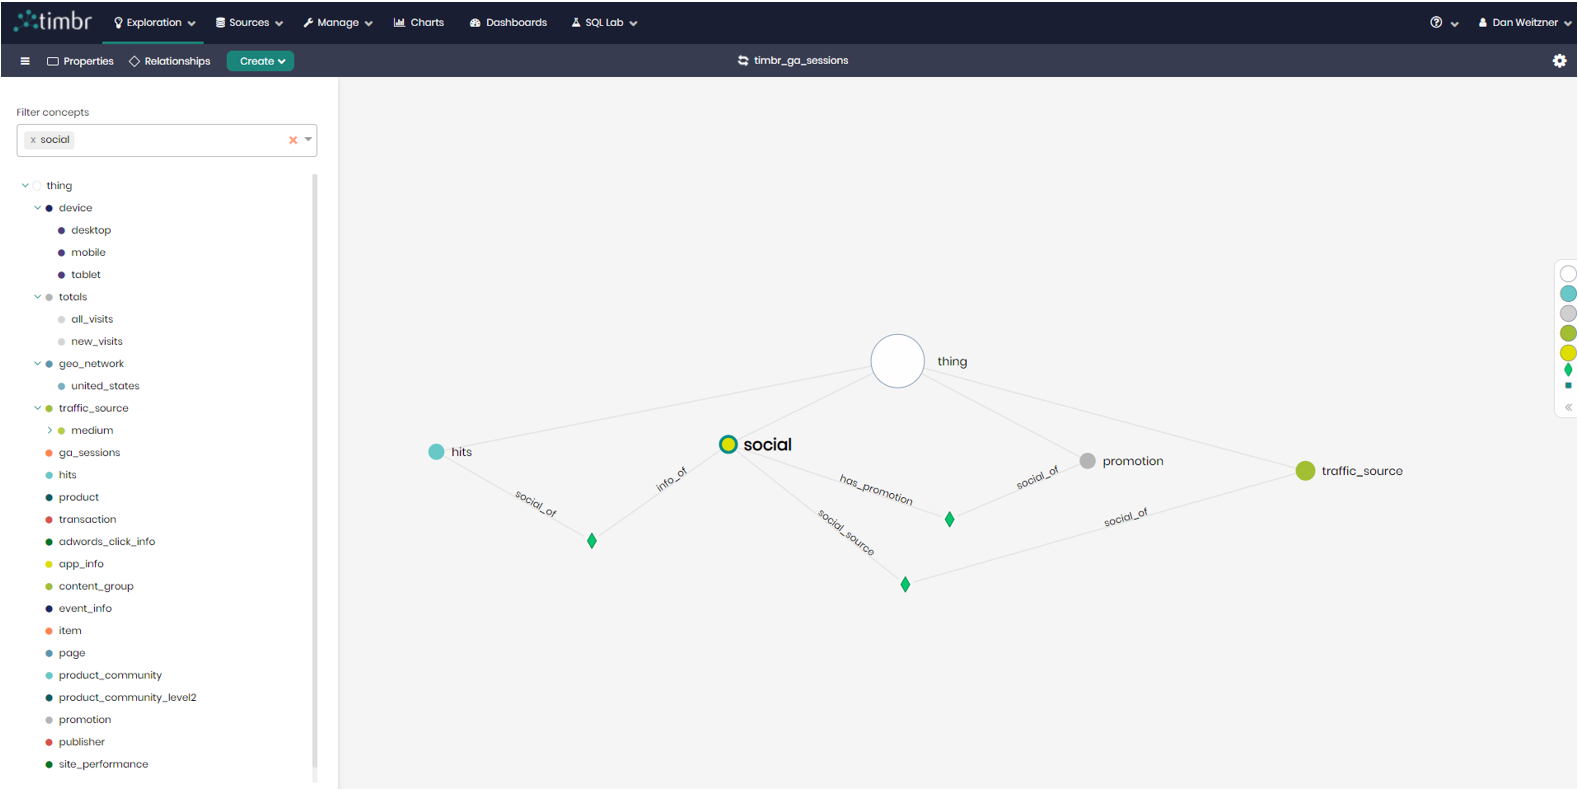
More specifically we are interested in the social concept since it has relationships to campaigns, promotions, and visits (hits). If we look at the subset of the knowledge graph, based on the social concept, it looks like this:
Now that we know what we want to connect to Looker Studio, we can start the integration process.
Adding a Timbr concept as a Looker Studio data source
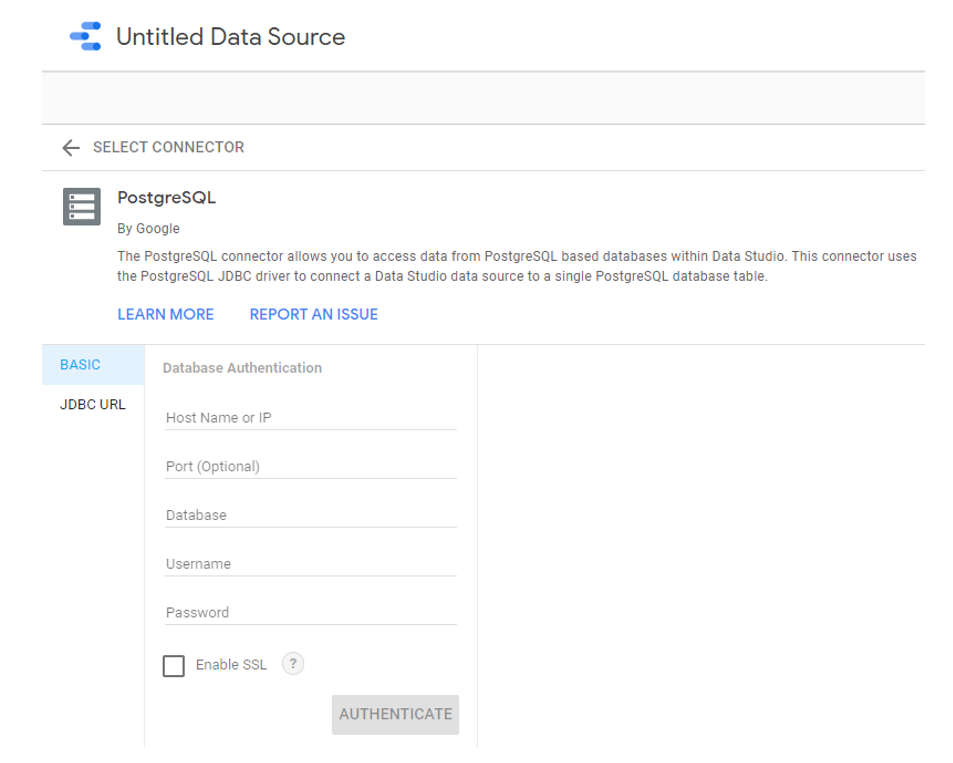
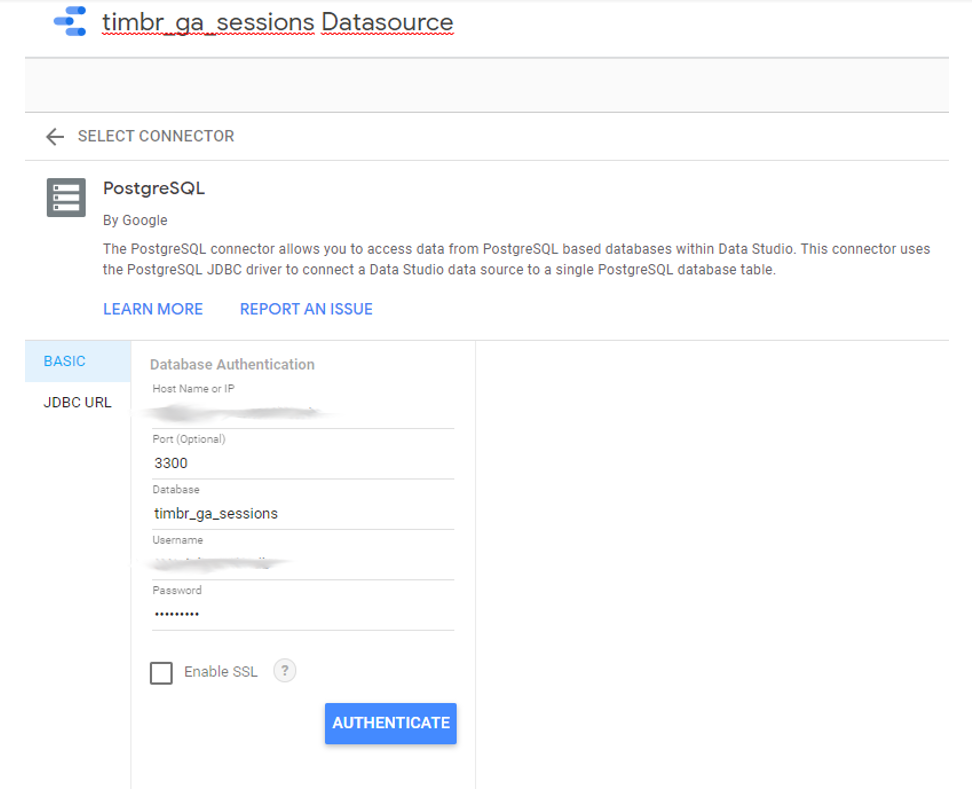
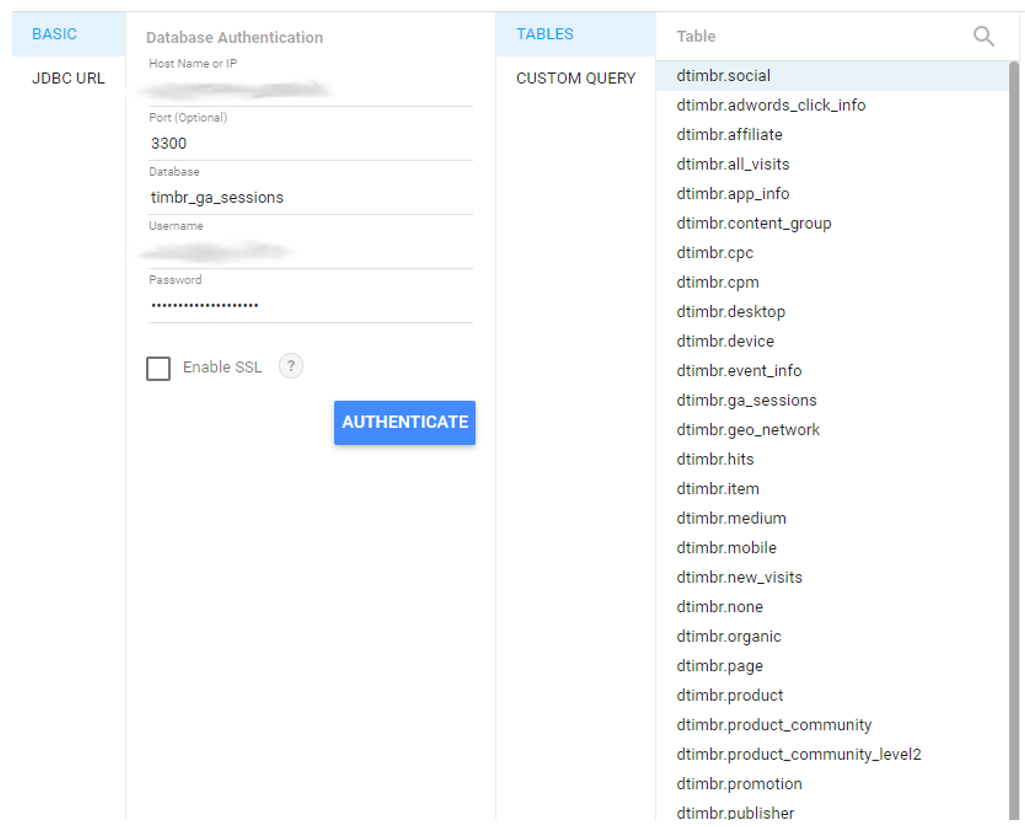
The first step in the integration of Looker Studio and Timbr is to create a new data source based on PostgreSQL since it’s a connector supported by Timbr and Looker Studio. On the next page, you will be asked to fill in the connection information. You will need to use the address and credentials provided with your Timbr license.
The page will look something like this before you fill in the required information:
Once filled in, it should look something like this:
We click on the Authenticate button and if the information entered is correct, we should see a list of the concepts as tables available, all in the dtimbr schema.
As mentioned before, we want to choose the social concept, so we select dtimbr.social from the list of tables presented.
After we select the desired table, we click on the Connect button in the top right corner.
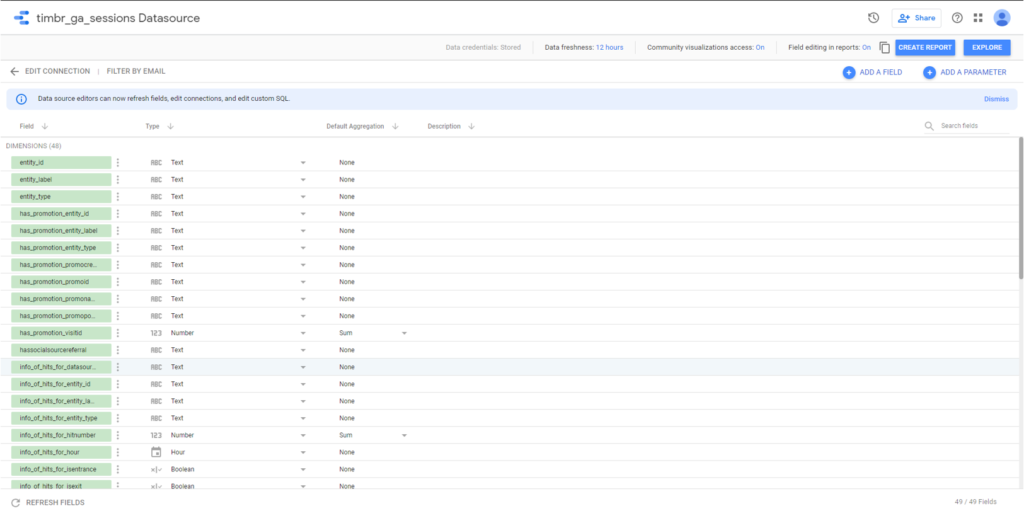
Looker Studio initiates a connection with Timbr and retrieves the metadata of the selected concept. In social, we have many properties and relationships to other concepts. Each property and relationship is displayed as another field in the metadata.
On this page, we can rename any fields to have more indicative names. However, the knowledge graph we are using was modeled correctly, the renaming step is therefore not necessary.
Then we click on the Create Report button to create our report.

Now we are all set to create the report from the context of the social concept in the knowledge graph.
Producing the report
The report should include the information that was specified above, so for each task, we create a chart or two to answer the requirements.
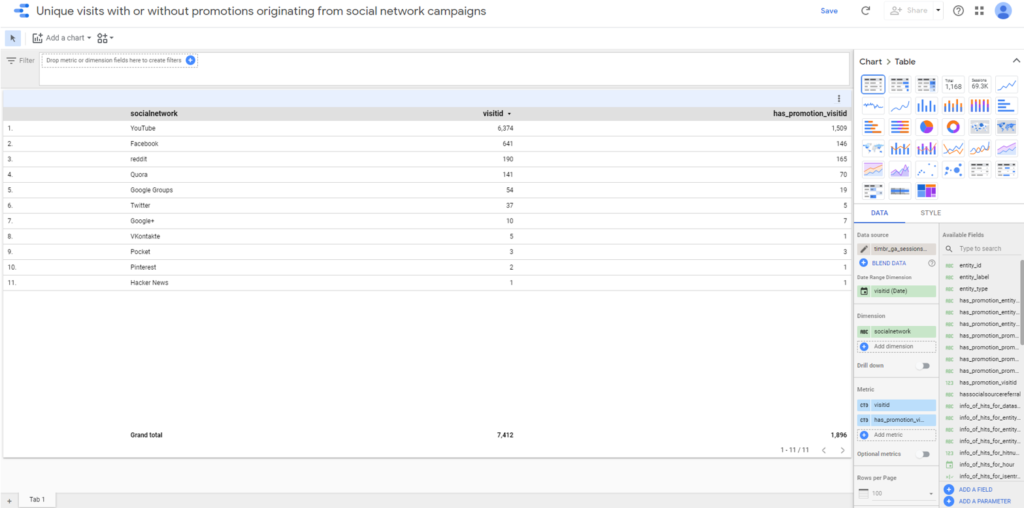
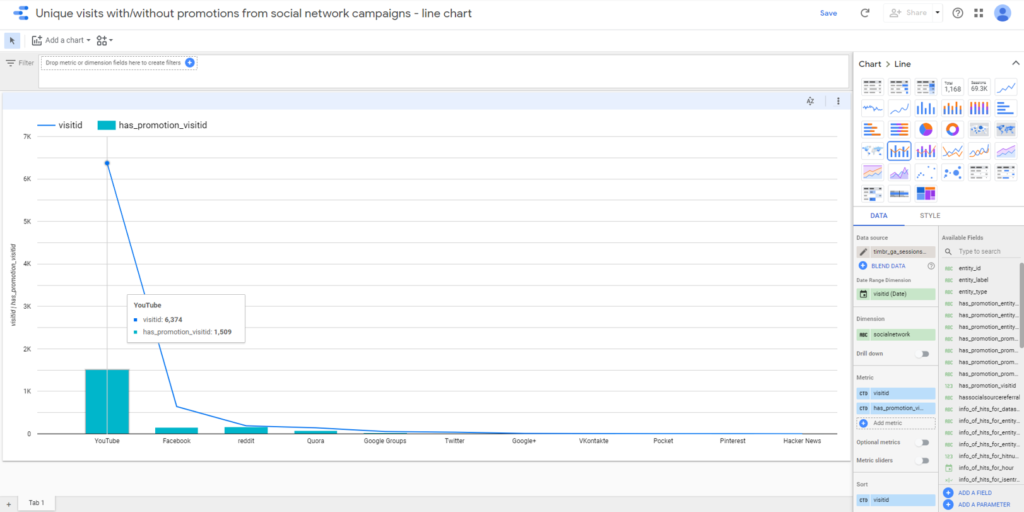
For the first requirement, Unique visits with or without promotions originating from social network campaigns, we need the following information:
- All the available social network campaigns.
- We can extract the information from the field named socialnetwork
- Count of the unique visitors.
- We extract the information from the field named visitid
- Count of the unique visitors with promotions.
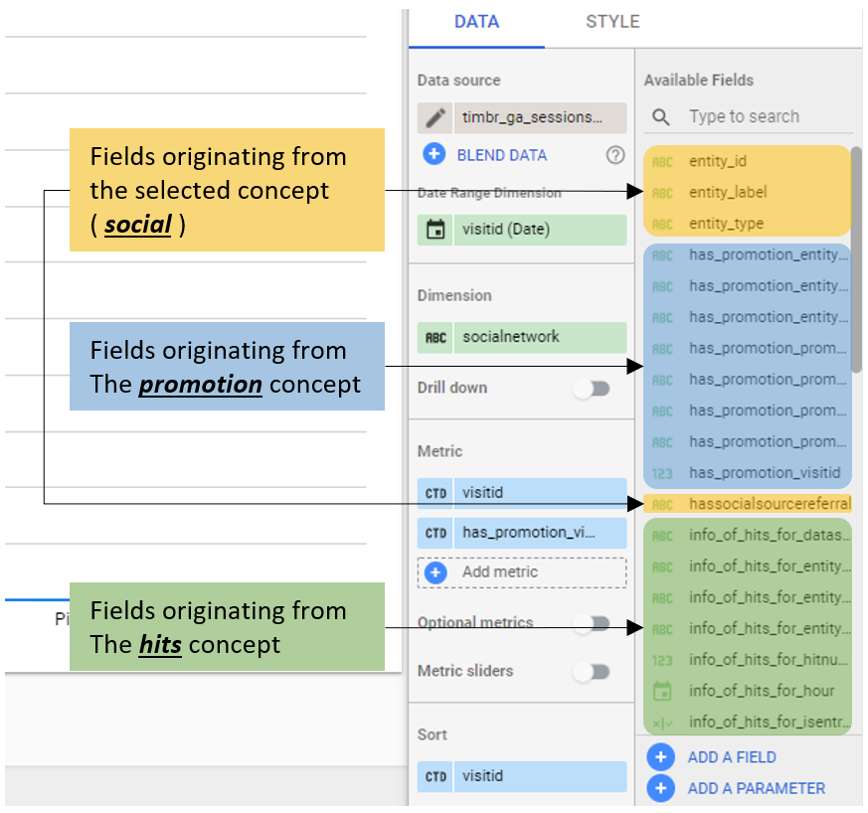
- This information is in a different concept named promotion, in a field named visitorid which represents a visit with promotion. Our source concept social has a relationship to the concept promotion named has_promotion. Therefore, when we view the social concept, any property of the promotion concept will be exposed in the metadata just as another column.
So, we are using a data source from the dtimbr schema, and the available fields that Looker Studio shows us include fields that are defined as relationships from and to the social concept.
We now have all the fields readily available to us, so all that’s left is to select the correct data fields and answer the tasks for our report.
We can also visualize it as a line chart with the same metrics and dimensions.
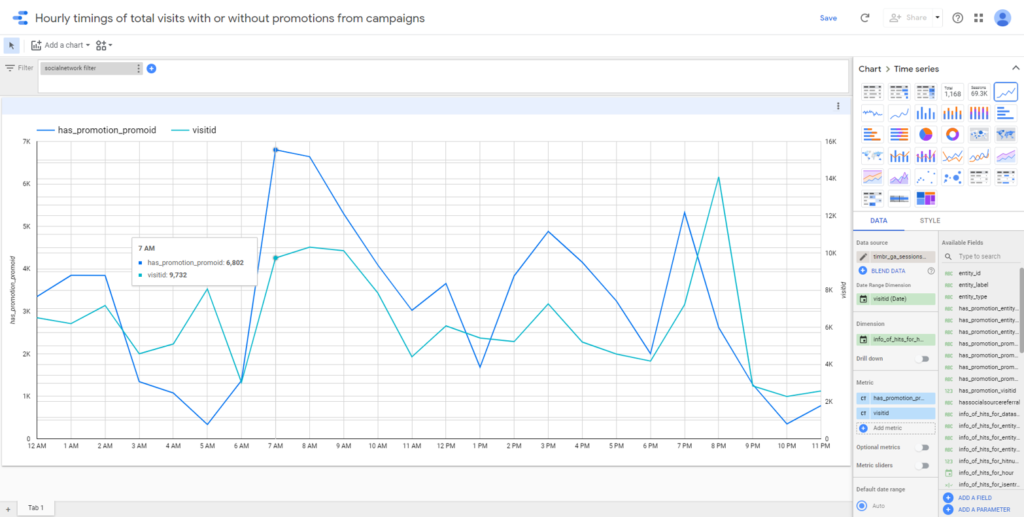
To answer the second requirement, Hourly timings of total visits with or without promotions from campaigns, we need the following information which is very similar to our previous chart:
- Count of the visit hits per hour.
- We can extract the information from the field named info_of_hits_for_hour. This field represents the property hour in the hits concept, which is available through the relationship named info_of (between the social concept and the hits concept)
- Count of the unique visitors.
- We can extract the information from the field named visitid
- Count of the unique visitors with promotions.
- We can extract the information from the field has_promotion_visitid (which is a property in the promotion concept)
Exploring the data looks like this in Looker Studio:
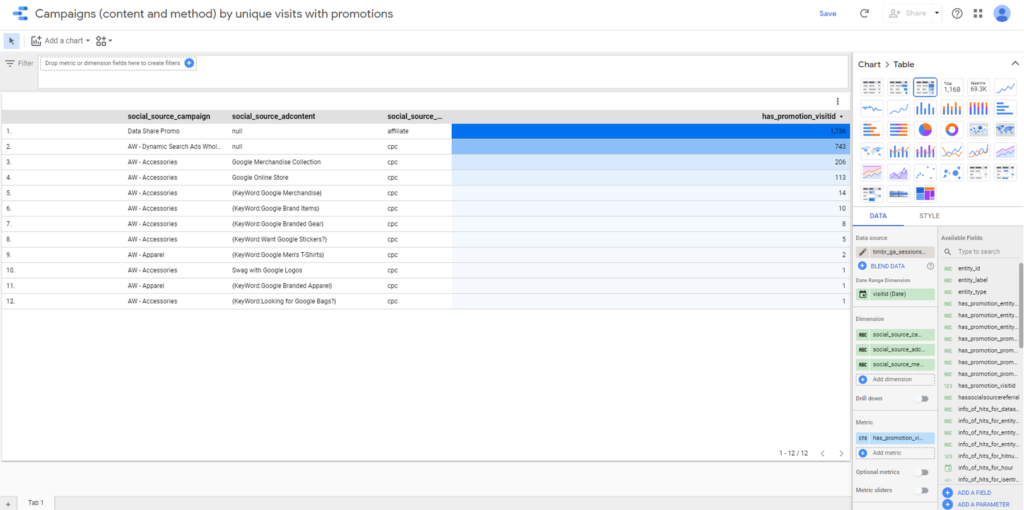
We can now move on to the third requirement, Campaigns (content and method) by unique visits with promotions, for which we need the following:
- The name of the social source campaign from the field named social_source_campaign. This field represents the property campaign in the source_traffic concept, which is available through the relationship named social_source (between the social concept and the source_traffic concept)
- The ad content of the social source campaign from the field named social_source_adcontent. This field represents the property adcontent in the source_traffic concept, which is available through the relationship named social_source
- The medium type of the social source campaign from the field named social_source_medium. This field represents the property medium in the source_traffic concept, which is available through the relationship named social_source
- Count of the unique visitors with promotions, which can be extracted from the field has_promotion_visitid (which is a property in the promotion concept).
We have completed the charts required for our report.
Producing the end-result was very easy since all the data was readily available to select with each chart. The end-result looks like this:
Conclusion
Timbr helps Looker Studio users to create and deliver complex reports much faster and in a simpler manner. With Timbr, data consumers can easily understand, explore, and query the data by means of concepts, instead of dealing with many tables and columns.
Contact us to test drive Looker Studio with Timbr on your dataset or on your own GA360 BigQuery export. Set up in just a few minutes so you can start unleashing the power of your data today.
How do you make your data smart?
Timbr virtually transforms existing databases into semantic SQL knowledge graphs with inference and graph capabilities, so data consumers can deliver fast answers and unique insights with minimum effort.

